OPEN-SOURCE SCRIPT
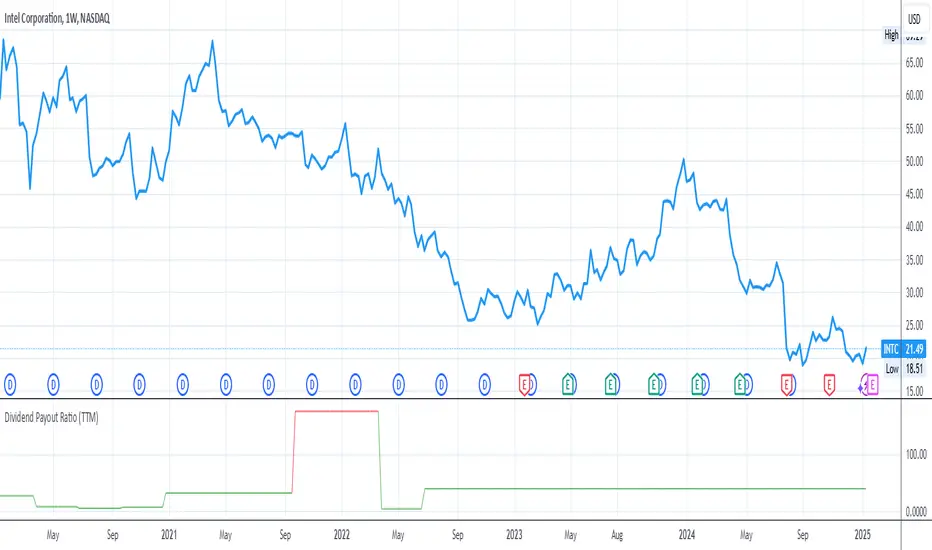
Dividend Payout Ratio

Shows the dividend payout ratio for the specific stock.
The dividend payout ratio indicates if the dividend payout is sustainable in the long run. Therefore,
1. A dividend payout under 50% is considered sustainable. The line will be green
2. A dividend payout over 50% and under 100%, the line will be yellow, is considered a stock to investigate since the dividend payout may have to be cut in the future which will cause the stock price to crash.
3. A dividend payout over 100%, the line will be red, is considered unsustainable and the dividend payout will most likely be cut in the near future. It can take up to a few years for the dividend cut to happen if the financials do not improve.
If the dividend payout ratio is over 100%, this means that the company is paying a dividend amount over $1 for every $1 earned. Therefore, the company must borrow money or find another source to pay the dividend amount that the company cannot afford to pay with the current earnings.
Calculating the dividend payout ratio:
Divide dividend paid by earnings after tax and multiplying the result by 100%.
Skrip open-source
Dengan semangat TradingView yang sesungguhnya, pembuat skrip ini telah menjadikannya sebagai sumber terbuka, sehingga para trader dapat meninjau dan memverifikasi fungsinya. Salut untuk penulisnya! Meskipun Anda dapat menggunakannya secara gratis, perlu diingat bahwa penerbitan ulang kode ini tunduk pada Tata Tertib kami.
Pernyataan Penyangkalan
Informasi dan publikasi ini tidak dimaksudkan, dan bukan merupakan, saran atau rekomendasi keuangan, investasi, trading, atau jenis lainnya yang diberikan atau didukung oleh TradingView. Baca selengkapnya di Ketentuan Penggunaan.