PROTECTED SOURCE SCRIPT
Diupdate GANN-ORB-RSI-BS

Gann relied heavily on geometrical and numerical relationships
and created several tools to help with his work. Among these
tools are the Square of Nine, Square of 144, and the Hexagon.
The Square of Nine, or Square as we will refer to here, can be
constructed in at least two ways. The static Square has the
number 1 at the center and the dynamic Square has the historic
low of the time series in the center.
Catatan Rilis
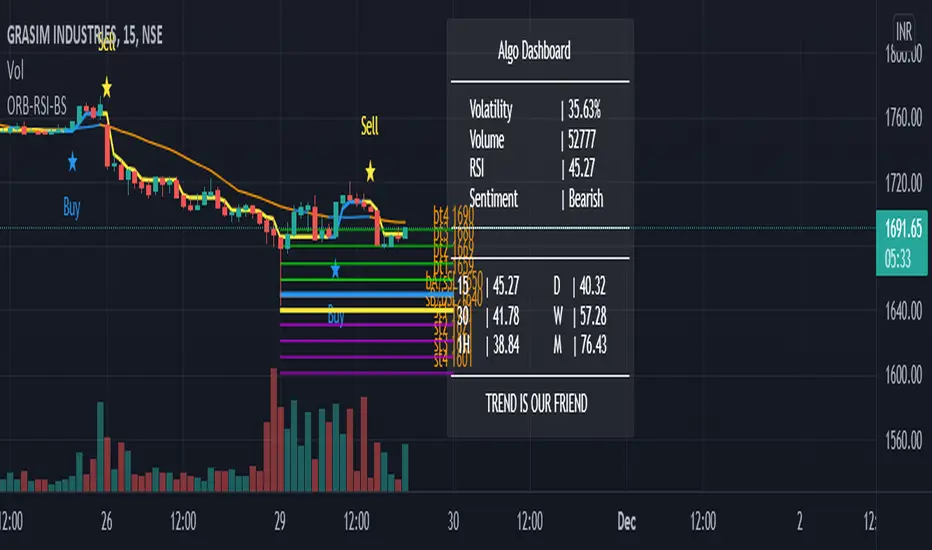
How to use Gann?Gann levels are given as targets on buy and sell sides.
Buy condition - when green candle closes above bA, blue line and exit at bt1/bt2/bt3. Stoploss is the yellow line value.
Similarly for Sell condition, when red candle closes below sB, yellow line and exit at st1/st2/st3. Stoploss is the blue line value.
Skrip terproteksi
Skrip ini diterbitkan sebagai sumber tertutup. Namun, Anda dapat menggunakannya dengan bebas dan tanpa batasan apa pun – pelajari lebih lanjut di sini.
Pernyataan Penyangkalan
Informasi dan publikasi ini tidak dimaksudkan, dan bukan merupakan, saran atau rekomendasi keuangan, investasi, trading, atau jenis lainnya yang diberikan atau didukung oleh TradingView. Baca selengkapnya di Ketentuan Penggunaan.