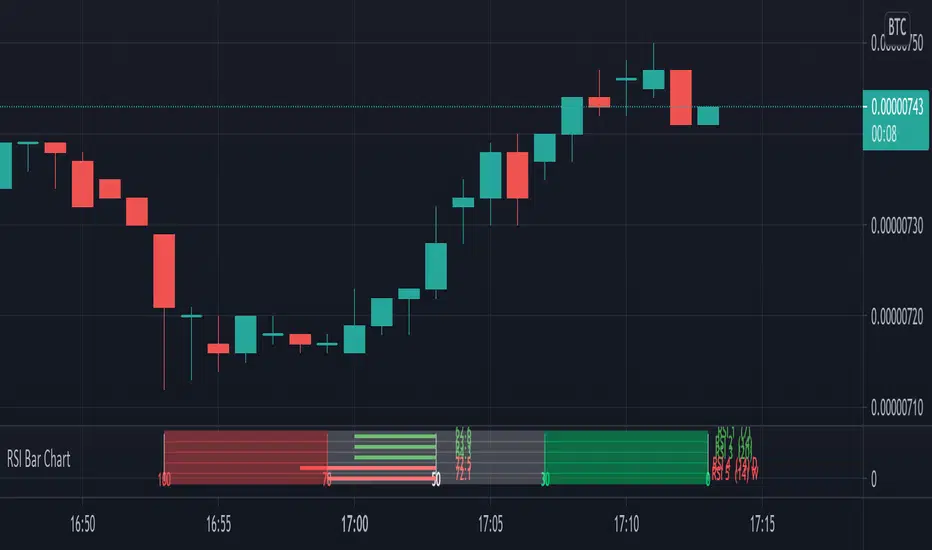
A different way to plot several RSI at once,
5 RSI with different options:
- source, length, timeframe
- size of indicator (width)
- color change
- limit change (30, 70), labels will be changed accordingly
- type of RSI line (line, arrow), linewidth
- offset label (at the right)
There are 4 colors (RSI line)
- when RSI > sell limit
- when RSI > 50 but below sell limit
- when RSI < 50 but above buy limit
- when RSI < buy limit


Arrows:

Different size:


Cheers!
5 RSI with different options:
- source, length, timeframe
- size of indicator (width)
- color change
- limit change (30, 70), labels will be changed accordingly
- type of RSI line (line, arrow), linewidth
- offset label (at the right)
There are 4 colors (RSI line)
- when RSI > sell limit
- when RSI > 50 but below sell limit
- when RSI < 50 but above buy limit
- when RSI < buy limit
Arrows:
Different size:
Cheers!
Catatan Rilis
Now every number (label) is changed when the label size is adjustedAlso shortened the script by adding f_rsi()
Catatan Rilis
Small bug fix -> labels at the right are now visible on symbols sessions that stop in the weekendCatatan Rilis
Blurry text/lines fixCatatan Rilis
UpdateSkrip open-source
Dengan semangat TradingView yang sesungguhnya, pembuat skrip ini telah menjadikannya sebagai sumber terbuka, sehingga para trader dapat meninjau dan memverifikasi fungsinya. Salut untuk penulisnya! Meskipun Anda dapat menggunakannya secara gratis, perlu diingat bahwa penerbitan ulang kode ini tunduk pada Tata Tertib kami.
Who are PineCoders?
tradingview.com/chart/SSP/yW5eOqtm-Who-are-PineCoders/
TG Pine Script® Q&A: t.me/PineCodersQA
- We cannot control our emotions,
but we can control our keyboard -
tradingview.com/chart/SSP/yW5eOqtm-Who-are-PineCoders/
TG Pine Script® Q&A: t.me/PineCodersQA
- We cannot control our emotions,
but we can control our keyboard -
Pernyataan Penyangkalan
Informasi dan publikasi ini tidak dimaksudkan, dan bukan merupakan, saran atau rekomendasi keuangan, investasi, trading, atau jenis lainnya yang diberikan atau didukung oleh TradingView. Baca selengkapnya di Ketentuan Penggunaan.
Skrip open-source
Dengan semangat TradingView yang sesungguhnya, pembuat skrip ini telah menjadikannya sebagai sumber terbuka, sehingga para trader dapat meninjau dan memverifikasi fungsinya. Salut untuk penulisnya! Meskipun Anda dapat menggunakannya secara gratis, perlu diingat bahwa penerbitan ulang kode ini tunduk pada Tata Tertib kami.
Who are PineCoders?
tradingview.com/chart/SSP/yW5eOqtm-Who-are-PineCoders/
TG Pine Script® Q&A: t.me/PineCodersQA
- We cannot control our emotions,
but we can control our keyboard -
tradingview.com/chart/SSP/yW5eOqtm-Who-are-PineCoders/
TG Pine Script® Q&A: t.me/PineCodersQA
- We cannot control our emotions,
but we can control our keyboard -
Pernyataan Penyangkalan
Informasi dan publikasi ini tidak dimaksudkan, dan bukan merupakan, saran atau rekomendasi keuangan, investasi, trading, atau jenis lainnya yang diberikan atau didukung oleh TradingView. Baca selengkapnya di Ketentuan Penggunaan.