PROTECTED SOURCE SCRIPT
Diupdate Jack Corsellis RS Line
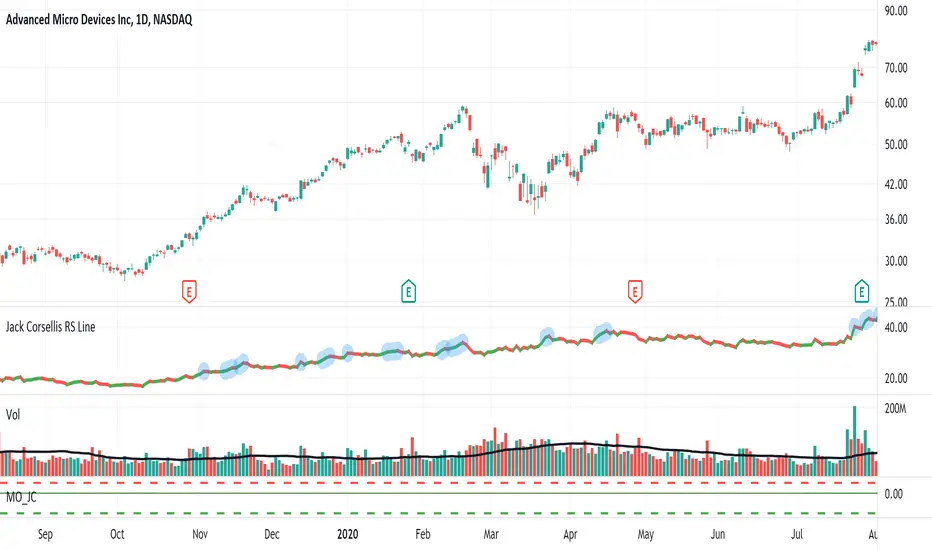
Relative Strength line which shows a blue dot for new 52 week Relative Strength highs.
Catatan Rilis
Jack Corsellis RS Line Rev 1Catatan Rilis
New update.Consistent 52 week blue dot high on daily, weekly and monthly.
No blue dots intraday.
Catatan Rilis
Revisions:1. Added the ability to plot a simple moving average (SMA) of the relative strength line.
This default is OFF (not displayed) and can be toggled ON (displayed) within the options.
The default SMA length is set to 50 days and can be configured within the options.
Catatan Rilis
Updated chart screenshotCatatan Rilis
Updated screenshotCatatan Rilis
Added Red Dot Low on Daily, Weekly and Monthly timeframes. No red dots will be displayed on intraday timeframes.Default look back period for lows is set to 52 weeks.
Indicator settings allow for this period to be configured, visibility of dot to be toggled and appearance to be changed.
Skrip terproteksi
Skrip ini diterbitkan sebagai sumber tertutup. Namun, Anda dapat menggunakannya dengan bebas dan tanpa batasan apa pun – pelajari lebih lanjut di sini.
Pernyataan Penyangkalan
Informasi dan publikasi ini tidak dimaksudkan, dan bukan merupakan, saran atau rekomendasi keuangan, investasi, trading, atau jenis lainnya yang diberikan atau didukung oleh TradingView. Baca selengkapnya di Ketentuan Penggunaan.