OPEN-SOURCE SCRIPT
Fibonacci Extension Distance Table

## 🧾 **Script Name**: Fibonacci Extension Distance Table
### 🎯 Purpose:
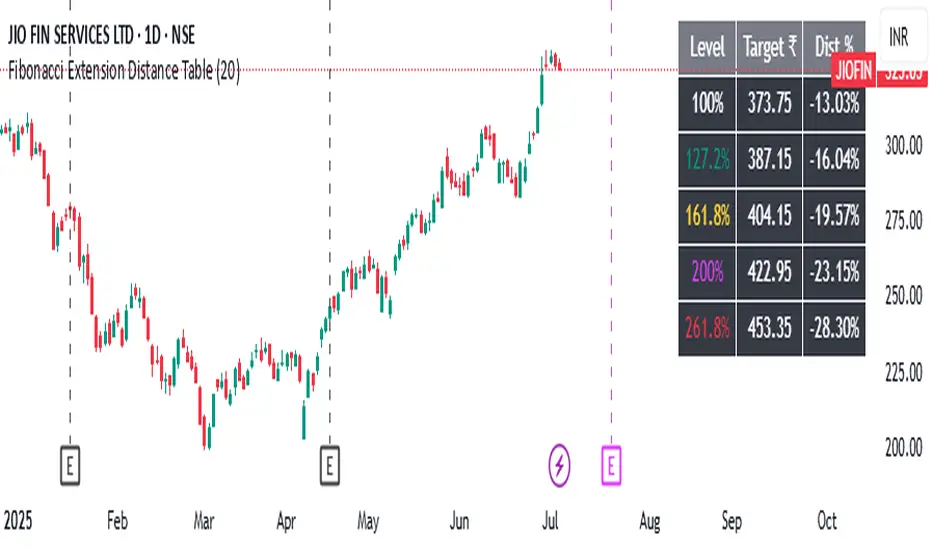
This script helps traders visually track **key Fibonacci extension levels** on any chart and immediately see:
* The **price target** at each extension
* The **distance in percentage** from the current market price
It is especially helpful for:
* **Profit targets in trending trades**
* Monitoring **potential resistance zones** in uptrends
* Planning **entry/exit timing**
---
## 🧮 **How It Works**
1. **Swing Logic (A → B → C)**
* It automatically finds:
* `A`: the **lowest low** in the last `swingLen` bars
* `B`: the **highest high** in that same lookback
* `C`: current bar’s low is used as the **retracement point** (simplified)
2. **Extension Formula**
Using the Fibonacci formula:
```text
Extension Price = C + (B - A) × Fibonacci Ratio
```
The script calculates projected target prices at:
* **100%**
* **127.2%**
* **161.8%** (Golden Ratio)
* **200%**
* **261.8%**
3. **Distance Calculation**
For each level, it calculates:
* The **absolute difference** between current price and the extension level
* The **percentage difference**, which helps quickly assess how close or far the market is from that target
---
## 📋 **Table Output in Top Right**
| Level | Target ₹ | Dist % from current price |
| ------ | ---------- | ------------------------- |
| 100% | Calculated | % Above/Below |
| 127.2% | Calculated | % Above/Below |
| 161.8% | Calculated | % Above/Below |
| 200% | Calculated | % Above/Below |
| 261.8% | Calculated | % Above/Below |
* The table updates **live on each bar**
* It **highlights levels** where price is nearing
* Useful in **any time frame** and **any market** (stocks, crypto, forex)
---
## 🔔 Example Use Case
You bought a stock at ₹100, and recent swing shows:
* A = ₹80
* B = ₹110
* C = ₹100
The 161.8% extension = 100 + (110 − 80) × 1.618 = ₹148.54
If the current price is ₹144, the table will show:
* Golden Ratio Target: ₹148.54
* Distance: −4.54
* Distance %: −3.05%
You now know your **target is near** and can plan your **exit or trailing stop**.
---
## 🧠 Benefits
* No need to draw extensions manually
* Automatically adapts to new swing structures
* Supports **scalping**, **swing**, and **positional** strategies
Skrip open-source
Dengan semangat TradingView yang sesungguhnya, pembuat skrip ini telah menjadikannya sebagai sumber terbuka, sehingga para trader dapat meninjau dan memverifikasi fungsinya. Salut untuk penulisnya! Meskipun Anda dapat menggunakannya secara gratis, perlu diingat bahwa penerbitan ulang kode ini tunduk pada Tata Tertib kami.
Pernyataan Penyangkalan
Informasi dan publikasi ini tidak dimaksudkan, dan bukan merupakan, saran atau rekomendasi keuangan, investasi, trading, atau jenis lainnya yang diberikan atau didukung oleh TradingView. Baca selengkapnya di Ketentuan Penggunaan.