OPEN-SOURCE SCRIPT
Regression Line (OLS) w/Residual Bands - Beasley Savage
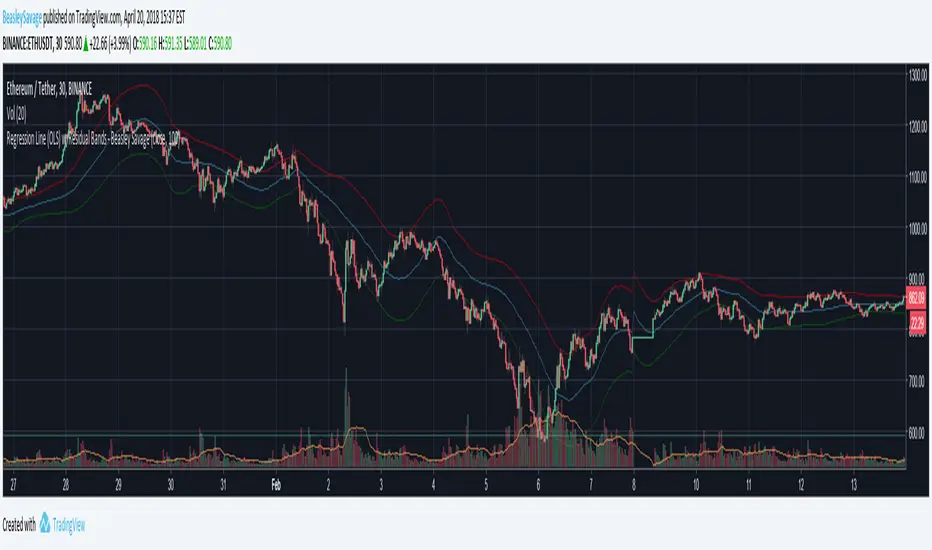
Plots linear regression "line of best fit" for a given source and length. Also plots the standard deviation of residuals as upper and lower bands. For some reason it's not plotting the lines exactly where the values are, so I wouldn't recommend using it as a purely visual indicator, but it could be used in strategies. A quick implementation of a strategy buying when the close crossed over the lower band and selling when close crossed under the upper band resulted in ~60-70% trade accuracy, not taking into account commission/slippage.
If anyone knows how to fix the lines not plotting accurately please let me know :)
If anyone knows how to fix the lines not plotting accurately please let me know :)
Skrip open-source
Dengan semangat TradingView yang sesungguhnya, pembuat skrip ini telah menjadikannya sebagai sumber terbuka, sehingga para trader dapat meninjau dan memverifikasi fungsinya. Salut untuk penulisnya! Meskipun Anda dapat menggunakannya secara gratis, perlu diingat bahwa penerbitan ulang kode ini tunduk pada Tata Tertib kami.
Pernyataan Penyangkalan
Informasi dan publikasi ini tidak dimaksudkan, dan bukan merupakan, saran atau rekomendasi keuangan, investasi, trading, atau jenis lainnya yang diberikan atau didukung oleh TradingView. Baca selengkapnya di Ketentuan Penggunaan.