OPEN-SOURCE SCRIPT
Maancyclus Volatiliteitsindicator (2025)
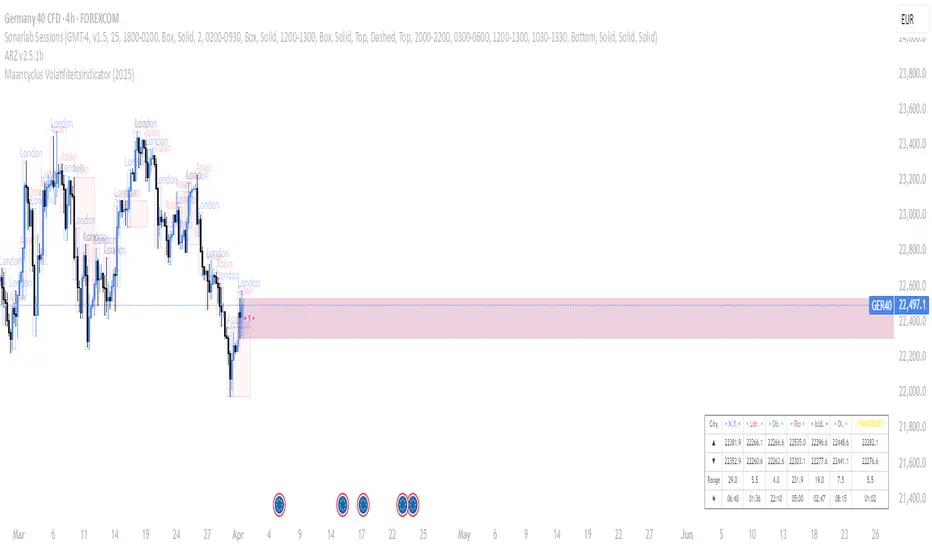
This Moon Cycle Volatility Indicator for TradingView is designed to help traders track and analyze market volatility around specific lunar phases, namely the Full Moon and New Moon. The indicator marks the dates of these moon phases on the chart and measures volatility using the Average True Range (ATR) indicator, which gauges market price fluctuations.
Key Features:
Moon Phase Markers: The indicator marks the Full Moon and New Moon on the chart using labels. Blue labels are placed below bars for Full Moons, while red labels are placed above bars for New Moons. These markers are based on a manually curated list of moon phase dates for the year 2025.
Volatility Calculation: The indicator calculates market volatility using the ATR (14), which provides a sense of market movement and potential risk. Volatility is plotted as histograms, with blue histograms representing volatility around Full Moons and red histograms around New Moons.
Comparative Analysis: By comparing the volatility around these moon phases to the average volatility, traders can spot potential patterns or heightened market movements. This can inform trading strategies, such as anticipating increased market activity around specific lunar events.
In essence, this tool helps traders identify potential high-volatility periods tied to lunar cycles, which could impact market sentiment and price action.
Skrip open-source
Dengan semangat TradingView yang sesungguhnya, pembuat skrip ini telah menjadikannya sebagai sumber terbuka, sehingga para trader dapat meninjau dan memverifikasi fungsinya. Salut untuk penulisnya! Meskipun Anda dapat menggunakannya secara gratis, perlu diingat bahwa penerbitan ulang kode ini tunduk pada Tata Tertib kami.
Pernyataan Penyangkalan
Informasi dan publikasi ini tidak dimaksudkan, dan bukan merupakan, saran atau rekomendasi keuangan, investasi, trading, atau jenis lainnya yang diberikan atau didukung oleh TradingView. Baca selengkapnya di Ketentuan Penggunaan.