OPEN-SOURCE SCRIPT
Diupdate Price Change History
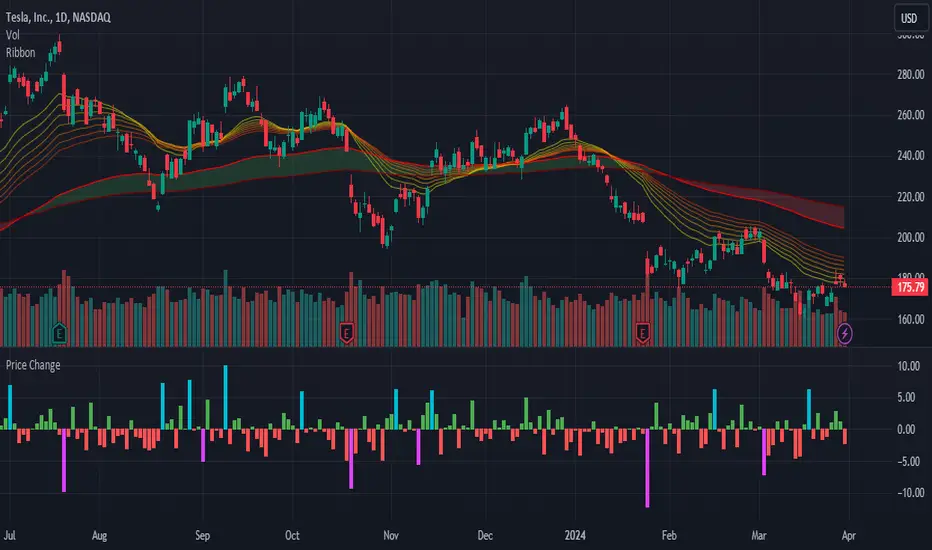
Display a histogram of price changes over a given interval. Show change as a percentage or in dollar amount. Highlight changes that exceed a particular value.
Catatan Rilis
By default, the histogram shows price change since the previous bar. This update allows you to display price change since any number of bars ago.Catatan Rilis
Separate high and low highlighting.Catatan Rilis
Update study shorttitle.Catatan Rilis
The ratio of highlighted to unhighlighted bars is now shown as the orange number ranging from 0 to 1.It takes into consideration the previous 50 bars by default, but can be changed by the user under settings.
Catatan Rilis
- Updated the names of a few settings to be clearer as to what they do.- Included some documentation in the source code to explain each setting.
Catatan Rilis
- Add default precision
- Improve comments
Catatan Rilis
Updated to Pine Script v4Catatan Rilis
- Update to Pine Script v5- Additional comments
- Code cleanup
Skrip open-source
Dengan semangat TradingView yang sesungguhnya, pembuat skrip ini telah menjadikannya sebagai sumber terbuka, sehingga para trader dapat meninjau dan memverifikasi fungsinya. Salut untuk penulisnya! Meskipun Anda dapat menggunakannya secara gratis, perlu diingat bahwa penerbitan ulang kode ini tunduk pada Tata Tertib kami.
Pernyataan Penyangkalan
Informasi dan publikasi ini tidak dimaksudkan, dan bukan merupakan, saran atau rekomendasi keuangan, investasi, trading, atau jenis lainnya yang diberikan atau didukung oleh TradingView. Baca selengkapnya di Ketentuan Penggunaan.