PROTECTED SOURCE SCRIPT
Diupdate Supply & Demand / Orderblocks - Multi TimeFrame (@JP7FX)

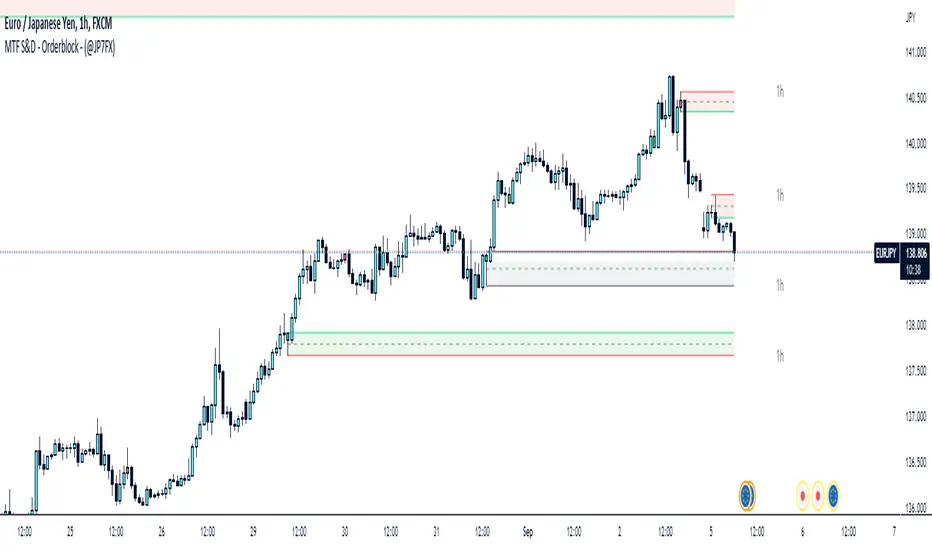
This should easily find the clear BUY to SELL / SELL to BUY candles with imbalance created.
There are options to change the Supply and Demand / OrderBlock CREATION based off the OPEN or WICK imbalance and also the option to DRAW the zones from the OPEN or the WICK.
Will also draw HTF zones with options to change the colour of zones when price has mitigated these areas, zones will be deleted once price has passed through.
Each Zone has the 50% line drawn and will delete when Price has reached - maybe useful for traders who look for 50% mitigation of areas.
When using HTF zones (max of 2) a Timeframe display will show for that zone.
There are many options to change colours and lines etc to suit the layout you prefer.
The zones that are created are not to trade from without additional analysis its simply to help draw strong zones.
Hope this provide some help and Trade Safe :)
Catatan Rilis
Due to the old script unable to pull the info from Higher Timeframes due to a restriction within PineScript this indicator has had to change slightly.The 'Chart' Timeframe will auto draw the zones as before but that will be the only Timeframe that can be selected, so the Timeframe you are on will draw those zones on the chart.
You can use Timeframe 2 to select a Higher Timeframe (HTF) for zones.
Unfortunately it is NOT possible yet to add in extra time frames due to the way this code runs to collect the HTF info.
If you do want extra then you could add the indicator again and have them both running and then Disable the Chart Timeframe and select another HTF from Timeframe 2.
Extra Time selections have been added and also an option to have the Bar from where the Zones are created to change colour... maybe for reference.
Trade Safe :)
Catatan Rilis
Alerts now added - Choose when new Orderblocks are created or Mitigated / Touched by price or turn both options on
You can also choose another TimeFrame to set alerts as well - I have tested this as much as I could and all seems to be fine.
Also the option to Disable one of the Timeframe alerts.
Catatan Rilis
I've enhanced the alert management system in the script, allowing greater flexibility. Now, users can personalise alert messages and even integrate webhooks if desired.Skrip terproteksi
Skrip ini diterbitkan sebagai sumber tertutup. Namun, Anda dapat menggunakannya dengan bebas dan tanpa batasan apa pun – pelajari lebih lanjut di sini.
Pernyataan Penyangkalan
Informasi dan publikasi ini tidak dimaksudkan, dan bukan merupakan, saran atau rekomendasi keuangan, investasi, trading, atau jenis lainnya yang diberikan atau didukung oleh TradingView. Baca selengkapnya di Ketentuan Penggunaan.
Skrip terproteksi
Skrip ini diterbitkan sebagai sumber tertutup. Namun, Anda dapat menggunakannya dengan bebas dan tanpa batasan apa pun – pelajari lebih lanjut di sini.
Pernyataan Penyangkalan
Informasi dan publikasi ini tidak dimaksudkan, dan bukan merupakan, saran atau rekomendasi keuangan, investasi, trading, atau jenis lainnya yang diberikan atau didukung oleh TradingView. Baca selengkapnya di Ketentuan Penggunaan.