PROTECTED SOURCE SCRIPT
KI-StageSpot V1
KI-StageSpot V1 – Stage & Base Structure Analysis
Concept & Purpose
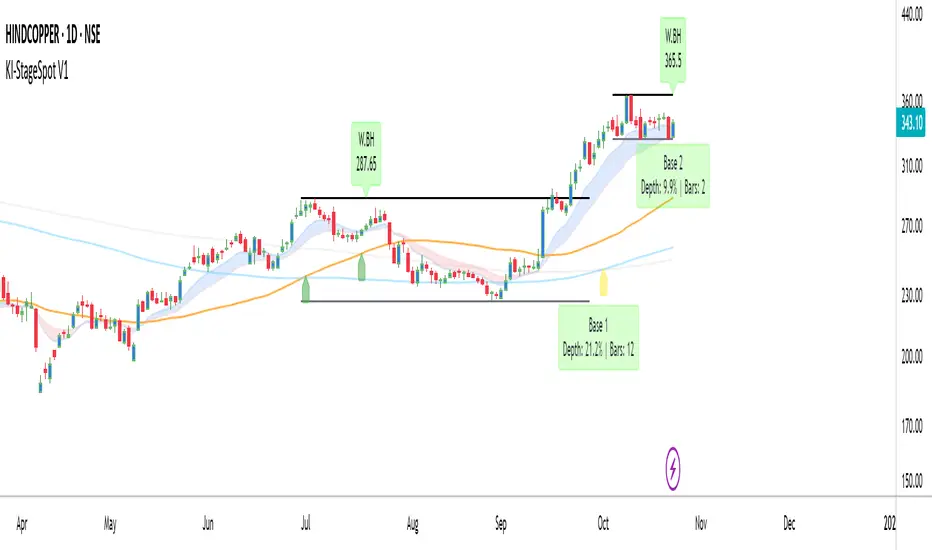
KI-StageSpot identifies Stage 1 to Stage 3 transitions by quantifying weekly base structures instead of relying only on moving average crossovers. Each base is derived from confirmed weekly pivot highs and lows that meet predefined duration and depth criteria. When a new low undercuts the prior base, the logic automatically merges the bases to preserve structural continuity. This framework is designed for traders studying trend evolution and Stage 2 continuation patterns.
Why this combination matters:
The script integrates structural (base tracking) and momentum (EMA Cloud) signals within one visual system. Weekly pivots and SMA-based stage markers outline the long-term structure, while the Daily EMA(10/20) Cloud reveals shorter-term momentum shifts inside each base. This cross-timeframe alignment helps confirm whether a breakout is supported by real strength or not.
How it works (conceptual overview)
•Weekly logic isolates each confirmed pivot high as a Base High (BH) and tracks the Base Low (BL) dynamically.
•Once price breaks above a BH, a Breakout (BO) label is triggered, and the base statistics freeze.
•Base statistics include Depth % and Duration (weeks), with optional color alerts for extended or deep corrections.
•Stage arrows derive from SMA(50/150/200) interactions to signal ST–MT–LT trend transitions.
•Timeframe-aware plotting ensures EMA clouds appear only on Daily, while SMAs and base logic stay internally synchronized on Weekly.
Key Features
•Automatic detection of Base Highs / Breakouts
•Base depth % and duration (weeks) labels
•Merge logic for undercut bases
•Daily EMA(10/20) Cloud for momentum tracking
•SMA 50 / 150 / 200 with stage arrows
•Customizable labels, offsets, and alerts
•Clean multi-TF plotting (Daily + Weekly)
Usage
•Start / End Date: Define your back-test window (e.g., post Stage 1 lockout or pre-Stage 2 base).
•Base Stats: Enable Depth % + Weeks; use alert levels Depth ≥ 30 %, Weeks > 12.
•EMA Cloud: Show = ON, Fast = 10, Slow = 20.
•SMAs: Show = ON (50 / 150 / 200 Daily; auto ≈ 10 / 30 / 40 Weekly).
•Labels: Compact or Expanded View per preference.
Analyze the structural setup on the Weekly chart and confirm early momentum through the Daily EMA cloud. When a breakout forms above a validated base high with supportive momentum, it often marks a Stage 2 expansion.
Concept & Purpose
KI-StageSpot identifies Stage 1 to Stage 3 transitions by quantifying weekly base structures instead of relying only on moving average crossovers. Each base is derived from confirmed weekly pivot highs and lows that meet predefined duration and depth criteria. When a new low undercuts the prior base, the logic automatically merges the bases to preserve structural continuity. This framework is designed for traders studying trend evolution and Stage 2 continuation patterns.
Why this combination matters:
The script integrates structural (base tracking) and momentum (EMA Cloud) signals within one visual system. Weekly pivots and SMA-based stage markers outline the long-term structure, while the Daily EMA(10/20) Cloud reveals shorter-term momentum shifts inside each base. This cross-timeframe alignment helps confirm whether a breakout is supported by real strength or not.
How it works (conceptual overview)
•Weekly logic isolates each confirmed pivot high as a Base High (BH) and tracks the Base Low (BL) dynamically.
•Once price breaks above a BH, a Breakout (BO) label is triggered, and the base statistics freeze.
•Base statistics include Depth % and Duration (weeks), with optional color alerts for extended or deep corrections.
•Stage arrows derive from SMA(50/150/200) interactions to signal ST–MT–LT trend transitions.
•Timeframe-aware plotting ensures EMA clouds appear only on Daily, while SMAs and base logic stay internally synchronized on Weekly.
Key Features
•Automatic detection of Base Highs / Breakouts
•Base depth % and duration (weeks) labels
•Merge logic for undercut bases
•Daily EMA(10/20) Cloud for momentum tracking
•SMA 50 / 150 / 200 with stage arrows
•Customizable labels, offsets, and alerts
•Clean multi-TF plotting (Daily + Weekly)
Usage
•Start / End Date: Define your back-test window (e.g., post Stage 1 lockout or pre-Stage 2 base).
•Base Stats: Enable Depth % + Weeks; use alert levels Depth ≥ 30 %, Weeks > 12.
•EMA Cloud: Show = ON, Fast = 10, Slow = 20.
•SMAs: Show = ON (50 / 150 / 200 Daily; auto ≈ 10 / 30 / 40 Weekly).
•Labels: Compact or Expanded View per preference.
Analyze the structural setup on the Weekly chart and confirm early momentum through the Daily EMA cloud. When a breakout forms above a validated base high with supportive momentum, it often marks a Stage 2 expansion.
Skrip terproteksi
Skrip ini diterbitkan sebagai sumber tertutup. However, you can use it freely and without any limitations – learn more here.
Pernyataan Penyangkalan
The information and publications are not meant to be, and do not constitute, financial, investment, trading, or other types of advice or recommendations supplied or endorsed by TradingView. Read more in the Terms of Use.