OPEN-SOURCE SCRIPT
Volume Flares
Volume Flares – Spotting Abnormal Volume by Time of Day
Most volume tools compare current volume to a moving average of the last X bars. That’s fine for seeing short-term changes, but it ignores how volume naturally ebbs and flows throughout the day.
Volume at 9:35 is not the same as volume at 1:15.
A standard MA will treat them the same.
What Volume Flares does differently:
Breaks the day into exact time slots (based on your chosen timeframe).
Calculates the historical average volume for each slot across past sessions.
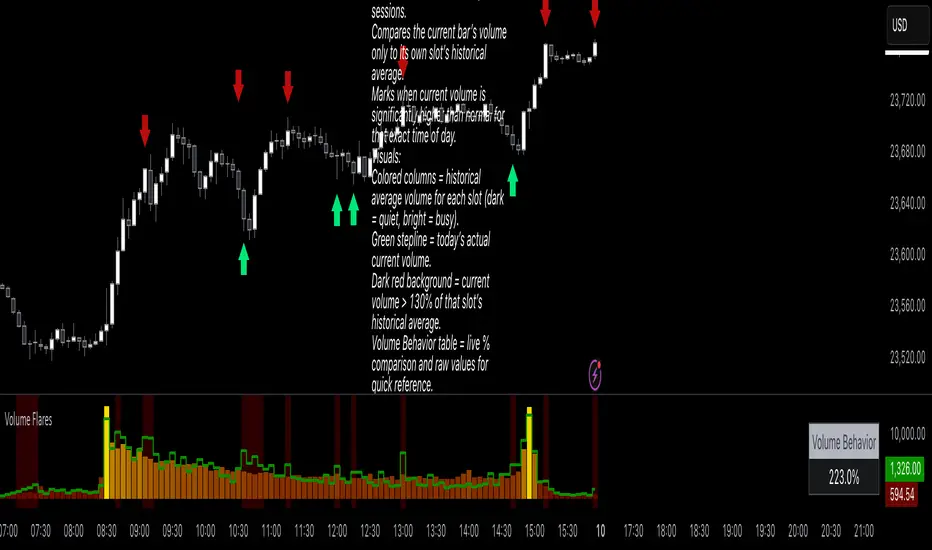
Compares the current bar’s volume only to its own slot’s historical average.
Marks when current volume is significantly higher than normal for that exact time of day.
Visuals:
Colored columns = historical average volume for each slot (dark = quiet, bright = busy).
Green stepline = today’s actual current volume.
Dark red background = current volume > 130% of that slot’s historical average.
Volume Behavior table = live % comparison and raw values for quick reference.
How I use it:
Red and green arrows on the price chart are manually drawn where the background turns red in the volume panel.
These often align with liquidity grabs, institutional entries, or areas where the market is “louder” than it should be for that moment in the day.
Helps filter out false urgency — high volume at the open isn’t the same as high volume in the lunch lull.
Key takeaway:
This is not a buy/sell signal.
It’s context.
It’s about spotting when the market is behaving out of character for that specific moment, and using that to read intent behind the move.
Most volume tools compare current volume to a moving average of the last X bars. That’s fine for seeing short-term changes, but it ignores how volume naturally ebbs and flows throughout the day.
Volume at 9:35 is not the same as volume at 1:15.
A standard MA will treat them the same.
What Volume Flares does differently:
Breaks the day into exact time slots (based on your chosen timeframe).
Calculates the historical average volume for each slot across past sessions.
Compares the current bar’s volume only to its own slot’s historical average.
Marks when current volume is significantly higher than normal for that exact time of day.
Visuals:
Colored columns = historical average volume for each slot (dark = quiet, bright = busy).
Green stepline = today’s actual current volume.
Dark red background = current volume > 130% of that slot’s historical average.
Volume Behavior table = live % comparison and raw values for quick reference.
How I use it:
Red and green arrows on the price chart are manually drawn where the background turns red in the volume panel.
These often align with liquidity grabs, institutional entries, or areas where the market is “louder” than it should be for that moment in the day.
Helps filter out false urgency — high volume at the open isn’t the same as high volume in the lunch lull.
Key takeaway:
This is not a buy/sell signal.
It’s context.
It’s about spotting when the market is behaving out of character for that specific moment, and using that to read intent behind the move.
Skrip open-source
Dengan semangat TradingView yang sesungguhnya, pembuat skrip ini telah menjadikannya sebagai sumber terbuka, sehingga para trader dapat meninjau dan memverifikasi fungsinya. Salut untuk penulisnya! Meskipun Anda dapat menggunakannya secara gratis, perlu diingat bahwa penerbitan ulang kode ini tunduk pada Tata Tertib kami.
Pernyataan Penyangkalan
Informasi dan publikasi ini tidak dimaksudkan, dan bukan merupakan, saran atau rekomendasi keuangan, investasi, trading, atau jenis lainnya yang diberikan atau didukung oleh TradingView. Baca selengkapnya di Ketentuan Penggunaan.