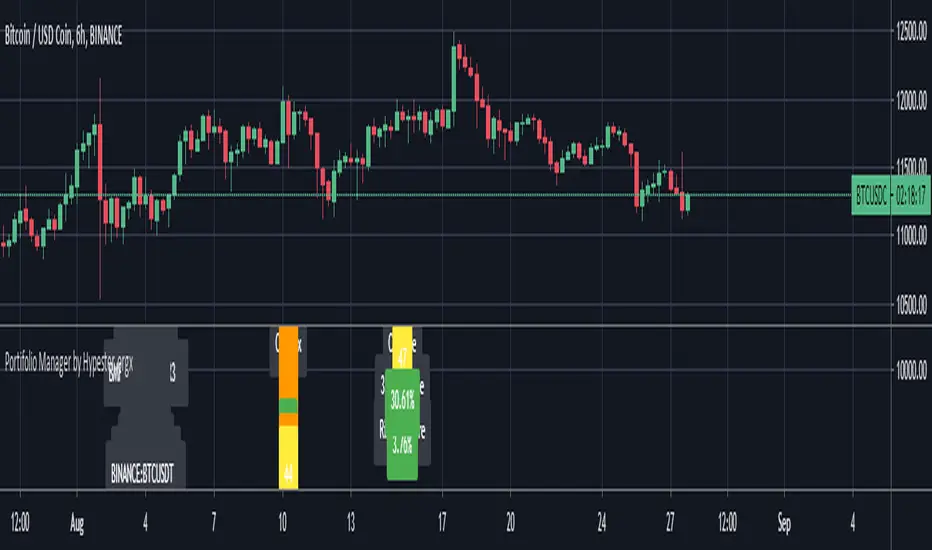
Portfolio Manager

The idea of such a tool was the lack of anything like that out there. Recently I've seen that the culture most common around the newcomers to trading has become extraordinarily scalping-like and much leaned on high-risk operations.
Fundamental cornerstones of math and statistics that are keys to lasting networth growth have been wholly forgotten.
One of the most efficient and simple ways that I tell my friends to make money without getting too technical is diversification.
It's merely math; I suggest reading about the Modern Portfolio Theory, based on the work about diversification of uncorrelated assets by Markowitz(Nobel-winner because of that).
Translating it to mere humans, the more assets you have, the more uncorrelated they are(as in their pattern of moves are nothing alike), the fewer risks of losing money in a given time you have.
So by following such stats, it's clear to say that's always important to trade on different fronts.
To quantify and qualify who diversified you are and how much risk you're taking, we decided to create a pretty handy tool.
Let's get the samba going:
C-Index is the individual correlation score of that asset compared to the given portfolio correlation average.
C-Score is the final correlation score of your portfolio.
Below that, we got the performance tracker, whatever timeframe you're benchmarking your portfolio, it will show there. I like to back-test for one year.
And last but not least, we have a proprietary risk exposure gauge, so we run a few math tricks, and we calculate how was the maximum of your investment that was exposed through-out the time range we set in. So let's say we have a 10% risk exposure over 365 days. It means that over one year at maximum we could have lost 10% of our investment.
If you're not familiar with correlation:
-> +100 score = Fully Correlated(Similar Behaviors)
-> 0 Score = Totally Uncorrelated(Different Behaviors)
-> -100 score = Inversely Correlated(Opposite Behaviors)
So any asset that averages between -20 and 20 is very little correlated to its comparison. Therefore, their pattern of behavior tend to be independent
By comparing the change and the risk exposure, you can assess your risk/reward ratio - golden information.
Not only that, but we also added several markets so you can easily benchmark your portfolio(up to 9 custom assets) to a diversified gamma of markets in the world.
We diversified each benchmark portfolio within its available industries for maximum risk mitigation.
You can change your benchmark range, nine custom assets, labels preferences, and nine benchmark portfolios, including NIKKEI, NASDAQ, IBOV , ASX , DAX , CRYPTO, FOREX, FTSE , SHANGHAI.
If you liked what you see take a look at our signare to get access to our scripts!
Skrip hanya-undangan
Hanya pengguna yang disetujui oleh penulis yang dapat mengakses skrip ini. Anda perlu meminta dan mendapatkan izin untuk menggunakannya. Izin ini biasanya diberikan setelah pembayaran. Untuk detail selengkapnya, ikuti petunjuk penulis di bawah ini atau hubungi spectertrading secara langsung.
TradingView TIDAK menyarankan untuk membayar atau menggunakan skrip kecuali Anda sepenuhnya mempercayai pembuatnya dan memahami cara kerjanya. Anda juga dapat menemukan alternatif yang gratis dan sumber terbuka di skrip komunitas kami.
Instruksi penulis
Pernyataan Penyangkalan
Skrip hanya-undangan
Hanya pengguna yang disetujui oleh penulis yang dapat mengakses skrip ini. Anda perlu meminta dan mendapatkan izin untuk menggunakannya. Izin ini biasanya diberikan setelah pembayaran. Untuk detail selengkapnya, ikuti petunjuk penulis di bawah ini atau hubungi spectertrading secara langsung.
TradingView TIDAK menyarankan untuk membayar atau menggunakan skrip kecuali Anda sepenuhnya mempercayai pembuatnya dan memahami cara kerjanya. Anda juga dapat menemukan alternatif yang gratis dan sumber terbuka di skrip komunitas kami.