PROTECTED SOURCE SCRIPT
Auto HTF Candles [@gaucho_trader]
[Auto HTF Candles [gaucho_trader]
(Title)
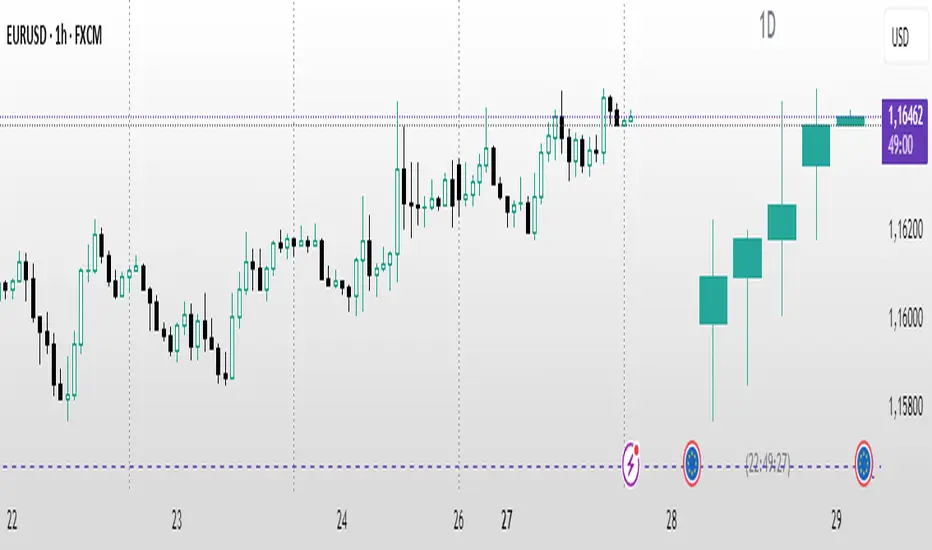
Tired of constantly switching between timeframes? 🔄 This indicator solves that problem by bringing Higher Timeframe (HTF) context directly onto your current chart.
Auto HTF Candles plots up to three different sets of HTF candles in a clean, non-intrusive panel on the right side of your screen. Now you can watch a 4H candle develop while analyzing price action on a 5-minute chart, all in one view.
Core Concept 🎯
The principle is simple: your lower timeframe (LTF) trading decisions become significantly more powerful when aligned with the HTF trend and structure. By displaying the live HTF candles, you can instantly see if the current LTF move is a weak pullback against a strong HTF candle or a powerful breakout from an HTF consolidation. This indicator provides that essential macro context without ever leaving your main chart.
Key Features 📊
📈 Display Multiple Timeframes: Plot up to three fully independent higher timeframes simultaneously (e.g., 15m, 1H, and 4H).
🤖 Automatic HTF Selection: Enable the "Auto-Adjust HTF 1" feature, and the script will intelligently select a logical higher timeframe for you based on your current chart.
⏳ Real-Time Countdown Timer: Each timeframe displayed includes a timer showing the exact time remaining until the current HTF candle closes. This is crucial for anticipating end-of-candle volatility.
🎨 Fully Customizable Appearance: You have complete control over the visual style. Adjust colors, candle width, spacing, and the padding from the live price.
✨ Clean & Organized Layout: The candles are neatly arranged to the right of the current price, ensuring your main chart remains clear and unobstructed.
How to Use It 💡
Context is King: Use the HTF candles to define your bias. If the 4H candle is strongly bullish, you can look for more confident long entries on your 5m chart.
Identify Key Levels in Real-Time: Watch the highs and lows of the HTF candles as they form. These levels often act as powerful intraday support and resistance.
Anticipate Reversals: Is the 1H candle approaching its close and printing a long upper wick? This could signal a potential reversal, giving you a heads-up before the pattern is obvious on the LTF.
Streamline Your Workflow: Use the "Auto-Adjust" feature for a dynamic analysis setup. As you switch between different charts, your most relevant HTF context will follow you automatically.
Main Settings ⚙️
HTF 1, 2, 3: Enable and select up to three custom timeframes and set how many recent candles you want to display for each.
Auto-Adjust HTF 1: The star of the show. Toggle this on to let the script automatically select the first HTF based on your chart's period.
Styling: A comprehensive section to modify all colors, candle width, and the spacing between candles and timeframes.
Label Settings: Independently control the visibility, color, and size of the HTF name labels and the countdown timers.
⚠️ Disclaimer
This indicator is a tool for market analysis and should not be considered financial advice. Trading involves significant risk. Always perform your own due diligence before making any trading decisions.
(Title)
Tired of constantly switching between timeframes? 🔄 This indicator solves that problem by bringing Higher Timeframe (HTF) context directly onto your current chart.
Auto HTF Candles plots up to three different sets of HTF candles in a clean, non-intrusive panel on the right side of your screen. Now you can watch a 4H candle develop while analyzing price action on a 5-minute chart, all in one view.
Core Concept 🎯
The principle is simple: your lower timeframe (LTF) trading decisions become significantly more powerful when aligned with the HTF trend and structure. By displaying the live HTF candles, you can instantly see if the current LTF move is a weak pullback against a strong HTF candle or a powerful breakout from an HTF consolidation. This indicator provides that essential macro context without ever leaving your main chart.
Key Features 📊
📈 Display Multiple Timeframes: Plot up to three fully independent higher timeframes simultaneously (e.g., 15m, 1H, and 4H).
🤖 Automatic HTF Selection: Enable the "Auto-Adjust HTF 1" feature, and the script will intelligently select a logical higher timeframe for you based on your current chart.
⏳ Real-Time Countdown Timer: Each timeframe displayed includes a timer showing the exact time remaining until the current HTF candle closes. This is crucial for anticipating end-of-candle volatility.
🎨 Fully Customizable Appearance: You have complete control over the visual style. Adjust colors, candle width, spacing, and the padding from the live price.
✨ Clean & Organized Layout: The candles are neatly arranged to the right of the current price, ensuring your main chart remains clear and unobstructed.
How to Use It 💡
Context is King: Use the HTF candles to define your bias. If the 4H candle is strongly bullish, you can look for more confident long entries on your 5m chart.
Identify Key Levels in Real-Time: Watch the highs and lows of the HTF candles as they form. These levels often act as powerful intraday support and resistance.
Anticipate Reversals: Is the 1H candle approaching its close and printing a long upper wick? This could signal a potential reversal, giving you a heads-up before the pattern is obvious on the LTF.
Streamline Your Workflow: Use the "Auto-Adjust" feature for a dynamic analysis setup. As you switch between different charts, your most relevant HTF context will follow you automatically.
Main Settings ⚙️
HTF 1, 2, 3: Enable and select up to three custom timeframes and set how many recent candles you want to display for each.
Auto-Adjust HTF 1: The star of the show. Toggle this on to let the script automatically select the first HTF based on your chart's period.
Styling: A comprehensive section to modify all colors, candle width, and the spacing between candles and timeframes.
Label Settings: Independently control the visibility, color, and size of the HTF name labels and the countdown timers.
⚠️ Disclaimer
This indicator is a tool for market analysis and should not be considered financial advice. Trading involves significant risk. Always perform your own due diligence before making any trading decisions.
Skrip terproteksi
Skrip ini diterbitkan sebagai sumber tertutup. Namun, Anda dapat menggunakannya dengan bebas dan tanpa batasan apa pun – pelajari lebih lanjut di sini.
Pernyataan Penyangkalan
Informasi dan publikasi ini tidak dimaksudkan, dan bukan merupakan, saran atau rekomendasi keuangan, investasi, trading, atau jenis lainnya yang diberikan atau didukung oleh TradingView. Baca selengkapnya di Ketentuan Penggunaan.