PROTECTED SOURCE SCRIPT
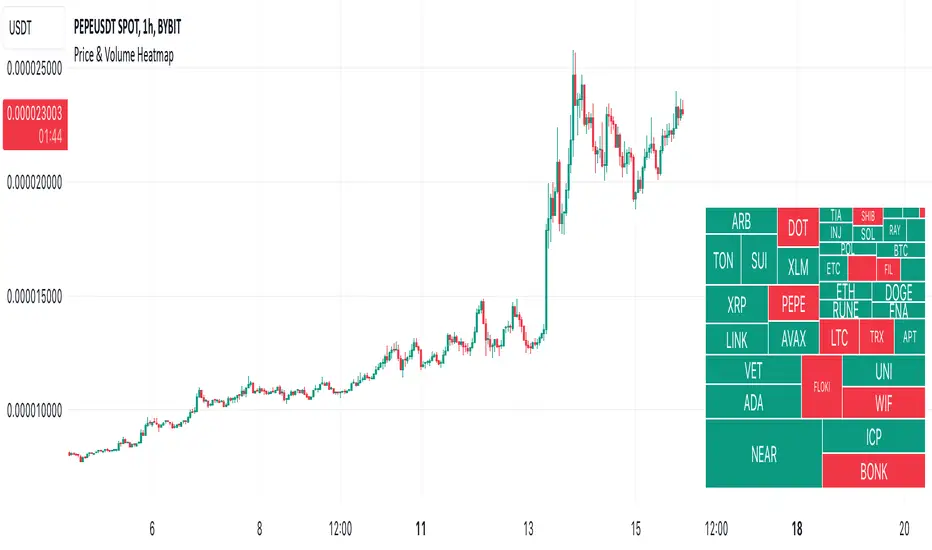
Price & Volume Heatmap

Description:
Displays a heatmap (like TV's Stock Heatmap) for up to 40 symbols (either from 3 presets, or custom). It can show Price Change, Volume Change and Volume (in $). The text size for each symbol can auto-change based on whether it fits into the cell. Each cell shows the name of the symbol, and when hovered - it shows the value.
Inputs:
- Symbols -> which symbols to use (Custom, or predefined list of Stocks/Crypto/Forex)
- Data -> show Price Change (%), Volume Change (%) or Volume ($)
- Custom -> put your custom list of symbols here (comma separated without spaces, up to 40 symbols)
- Position -> heatmap position
- Height / Width -> height / width of the heatmap (% of indicator's space)
- Text Size -> can be constant (Tiny/Normal/etc) or automatically change based on the text of each cell (Auto/Auto (Smaller))
- Color -> text color
Notes:
It is not recommended to use the script on timeframes below 30 seconds, because it may be too slow there (since it's based on a table object, it might be slow).
Skrip terproteksi
Skrip ini diterbitkan sebagai sumber tertutup. Namun, Anda dapat menggunakannya dengan bebas dan tanpa batasan apa pun – pelajari lebih lanjut di sini.
Pernyataan Penyangkalan
Informasi dan publikasi ini tidak dimaksudkan, dan bukan merupakan, saran atau rekomendasi keuangan, investasi, trading, atau jenis lainnya yang diberikan atau didukung oleh TradingView. Baca selengkapnya di Ketentuan Penggunaan.