OPEN-SOURCE SCRIPT
AndreundCristian

Indicator Overview:
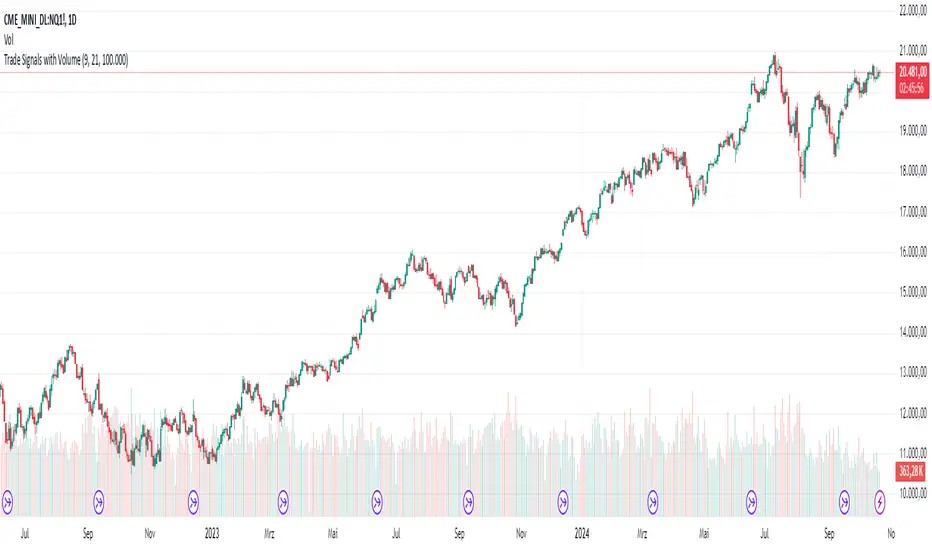
The "Trade Signals with Volume" indicator is a custom script that generates buy and sell signals based on the crossover of two moving averages (a fast one and a slow one) and adds a volume filter to validate these signals. It plots these signals directly on the chart, using arrows or labels to indicate where buy and sell signals occur.
Key Features:
Moving Averages (MA):
The indicator uses two Simple Moving Averages (SMA): a fast SMA and a slow SMA.
A buy signal is triggered when the fast MA crosses above the slow MA, signaling potential bullish momentum.
A sell signal is triggered when the fast MA crosses below the slow MA, indicating potential bearish momentum.
Volume Filter:
To ensure that signals are more reliable, the indicator only triggers a buy or sell signal if the volume is above a certain threshold. This threshold can be adjusted by the user in the input settings.
For example, if the volume exceeds 100,000 (or any set value), and a crossover occurs, the signal is validated.
Visual Representation:
Buy signals are represented with green labels or arrows below the price bars.
Sell signals are represented with red labels or arrows above the price bars.
The MAs are also plotted on the chart for visual reference.
Input Parameters:
Fast Moving Average Length: The number of periods for the fast SMA (default is 9 periods).
Slow Moving Average Length: The number of periods for the slow SMA (default is 21 periods).
Volume Threshold: The minimum volume required to validate a buy or sell signal (default is 100,000).
Skrip open-source
Dengan semangat TradingView yang sesungguhnya, pembuat skrip ini telah menjadikannya sebagai sumber terbuka, sehingga para trader dapat meninjau dan memverifikasi fungsinya. Salut untuk penulisnya! Meskipun Anda dapat menggunakannya secara gratis, perlu diingat bahwa penerbitan ulang kode ini tunduk pada Tata Tertib kami.
Pernyataan Penyangkalan
Informasi dan publikasi ini tidak dimaksudkan, dan bukan merupakan, saran atau rekomendasi keuangan, investasi, trading, atau jenis lainnya yang diberikan atau didukung oleh TradingView. Baca selengkapnya di Ketentuan Penggunaan.