OPEN-SOURCE SCRIPT
Diupdate {Gunzo} Vertical Horizontal Filter (Trading ranges)

Vertical Horizontal Filter indicator is a tool that can be used to identify market conditions (ranging or trending). It measures if the price is going vertical (uni-directional) or horizontal (non-directional).
OVERVIEW :
The Vertical Horizontal Filter is a technical analysis indicator created by Adam White in 1991. He described it in the “Issues of Futures” magazine for the first time. The indicator is only composed of one line that measures the level of trend activity.
If the VHF line is increasing, we consider that the trend is getting stronger (up-trend or down-trend). Otherwise, if the VHF line is decreasing, we consider that the trend is weakening (going sideways or even ranging) as the market is getting calmer
CALCULATION :
The level of trend activity is calculated as the ratio between the distance from the highest to the lowest value (on the last N days) and the movement of the closing price.
VHF = ( highest (high) – lowest (low) ) / sum( close – previous close)
SETTINGS :
VISUALIZATIONS :
This indicator has 3 possible visualizations :
OVERVIEW :
The Vertical Horizontal Filter is a technical analysis indicator created by Adam White in 1991. He described it in the “Issues of Futures” magazine for the first time. The indicator is only composed of one line that measures the level of trend activity.
If the VHF line is increasing, we consider that the trend is getting stronger (up-trend or down-trend). Otherwise, if the VHF line is decreasing, we consider that the trend is weakening (going sideways or even ranging) as the market is getting calmer
CALCULATION :
The level of trend activity is calculated as the ratio between the distance from the highest to the lowest value (on the last N days) and the movement of the closing price.
VHF = ( highest (high) – lowest (low) ) / sum( close – previous close)
SETTINGS :
- VHF length : Length of the vertical horizontal filter (28 or 18 recommended)
- VHF source : Source of the vertical horizontal filter (close recommended)
- VHF smoothing length : Extra smoothing applied on the VHF line to filter noise (1 or 6 or 9 or 14 recommended)
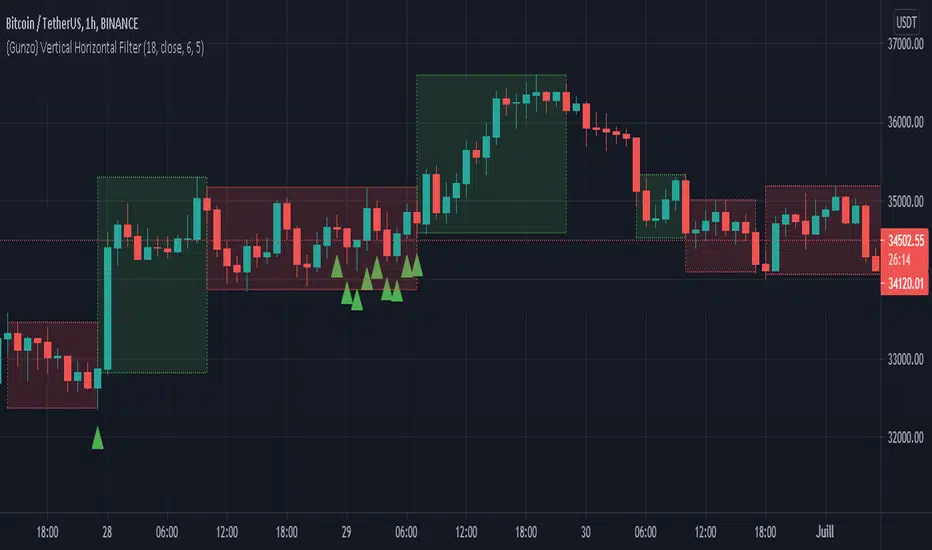
- Display ranging market rectangles : Display rectangles on the chart around the area where VHF is decreasing (ranging market)
- Display trending market rectangles : Display rectangles on the chart around the area where VHF is increasing (trending market up or down)
- Minimum rectangle size : Hide rectangles that are smaller than X candles
- Display signal line : Display circles at the bottom of the chart with the raw VHF direction (green if increasing /red if decreasing)
- Display VHF tops and bottoms : Display triangles if the VHF line is reaching a new high or new low over the last 100 candles. When consecutive triangles appear, it may be a sign that the current market conditions are ending. Green triangles mean the possible end of the ranging market and red triangles mean the possible end of the trending market.
VISUALIZATIONS :
This indicator has 3 possible visualizations :
- Rectangles : the rectangles are drawn on areas where the VHF is decreasing (red) or increasing (green) for a minimum number of consecutive candles. The first candles of an area may not be representative of the market conditions as the VHF line is still in extreme values but going slowly in the opposite direction. The market conditions (ranging or trending) get stronger with the VHF line keeping the same direction.
- Signal line : The signal line is the VHF raw data : the red circle is a decreasing VHF line, and the green circle is an increasing VHF line.
- Tops and bottoms : The tops and bottoms are signals indicating that the VHF line is reaching extreme values, there is a high probability that the market conditions are going to change after that.
USAGE :
This indicator can be used as a filter for strategies based on other technical analysis indicators.
If you are using trending indicators like moving averages, you should consider using them only when the market is trending. You can use VHF increasing to confirm that the market is not ranging.
If you are using oscillating indicators like stochastic or commodity channel index, you may prefer using them when the market is ranging as trending indicators may not be useful. You can use the VHF decreasing to confirm that the market is ranging.
Catatan Rilis
Updated screenshotCatatan Rilis
Updated screenshotCatatan Rilis
Updated screenshotCatatan Rilis
Updated screenshotCatatan Rilis
Added customizable timeframe for the VHF (HTF)Skrip open-source
Dengan semangat TradingView yang sesungguhnya, pembuat skrip ini telah menjadikannya sebagai sumber terbuka, sehingga para trader dapat meninjau dan memverifikasi fungsinya. Salut untuk penulisnya! Meskipun Anda dapat menggunakannya secara gratis, perlu diingat bahwa penerbitan ulang kode ini tunduk pada Tata Tertib kami.
Pernyataan Penyangkalan
Informasi dan publikasi ini tidak dimaksudkan, dan bukan merupakan, saran atau rekomendasi keuangan, investasi, trading, atau jenis lainnya yang diberikan atau didukung oleh TradingView. Baca selengkapnya di Ketentuan Penggunaan.
Skrip open-source
Dengan semangat TradingView yang sesungguhnya, pembuat skrip ini telah menjadikannya sebagai sumber terbuka, sehingga para trader dapat meninjau dan memverifikasi fungsinya. Salut untuk penulisnya! Meskipun Anda dapat menggunakannya secara gratis, perlu diingat bahwa penerbitan ulang kode ini tunduk pada Tata Tertib kami.
Pernyataan Penyangkalan
Informasi dan publikasi ini tidak dimaksudkan, dan bukan merupakan, saran atau rekomendasi keuangan, investasi, trading, atau jenis lainnya yang diberikan atau didukung oleh TradingView. Baca selengkapnya di Ketentuan Penggunaan.