OPEN-SOURCE SCRIPT
Candle Breakdown with Solid Tops/Bottoms
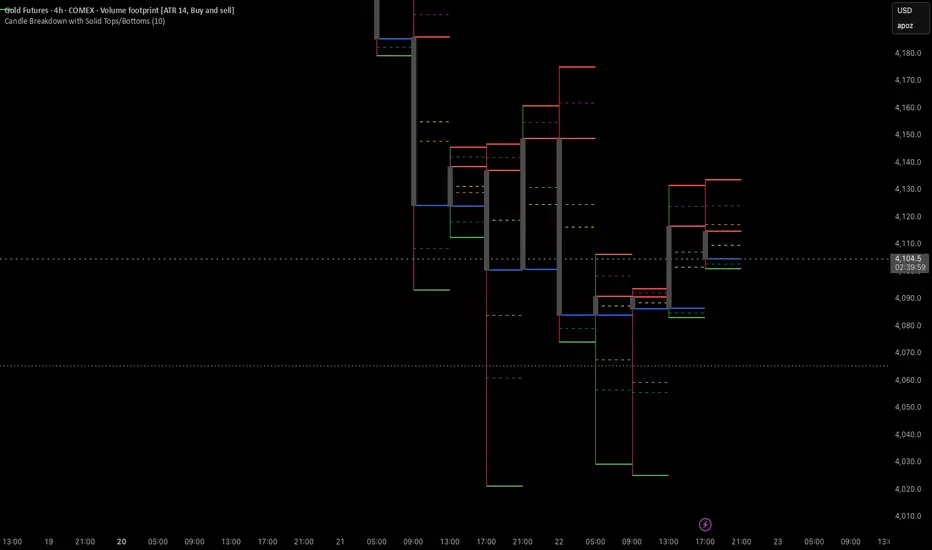
I incorporate this indicator on a 4hr chart and use the previous candle levels as support resistane/ targets/pivots for trades on the 1 min.
This Pine Script v5 indicator for TradingView, named "Candle Breakdown with Solid Tops/Bottoms," visually dissects each candlestick into four sections: whole candle (low to high), top wick (body top to high), body (open to close), and bottom wick (low to body bottom). For each section, it plots:Solid horizontal lines (width=2) at the top and bottom (e.g., high/low for whole candle, body top/bottom for body).
Dashed horizontal midlines (width=1) at the midpoint of each section (e.g., (high + low)/2 for whole candle).
Key features include:
Toggles: Enable/disable each section (whole, top wick, body, bottom wick) via checkboxes.
Custom Colors: Separate color inputs for top/bottom lines and midlines (defaults: gray, red, blue, green for sections; orange, purple, yellow, teal for midlines).
Lookback: User-defined input (default 10 candles) limits lines to the last N candles for clarity.
Labels: Optional price labels on the last bar for debugging.
The script uses line.new() for dynamic, per-candle lines, ensuring no errors (e.g., no invalid linestyle or linewidth<1). It’s efficient (up to 12 lines/candle, stays under max_lines_count=500) and works on any symbol/timeframe, enhancing swing trading analysis (e.g., for GC1! or NQ1!).
Skrip open-source
Dengan semangat TradingView yang sesungguhnya, penulis skrip ini telah menjadikannya sumber terbuka, sehingga para trader dapat meninjau dan memverifikasi fungsinya. Hormat untuk penulisnya! Meskipun anda dapat menggunakannya secara gratis, ingatlah bahwa penerbitan ulang kode tersebut tunduk pada Tata Tertib kami.
Pernyataan Penyangkalan
Informasi dan publikasi tidak dimaksudkan untuk menjadi, dan bukan merupakan saran keuangan, investasi, perdagangan, atau rekomendasi lainnya yang diberikan atau didukung oleh TradingView. Baca selengkapnya di Persyaratan Penggunaan.