OPEN-SOURCE SCRIPT
Back to the Future
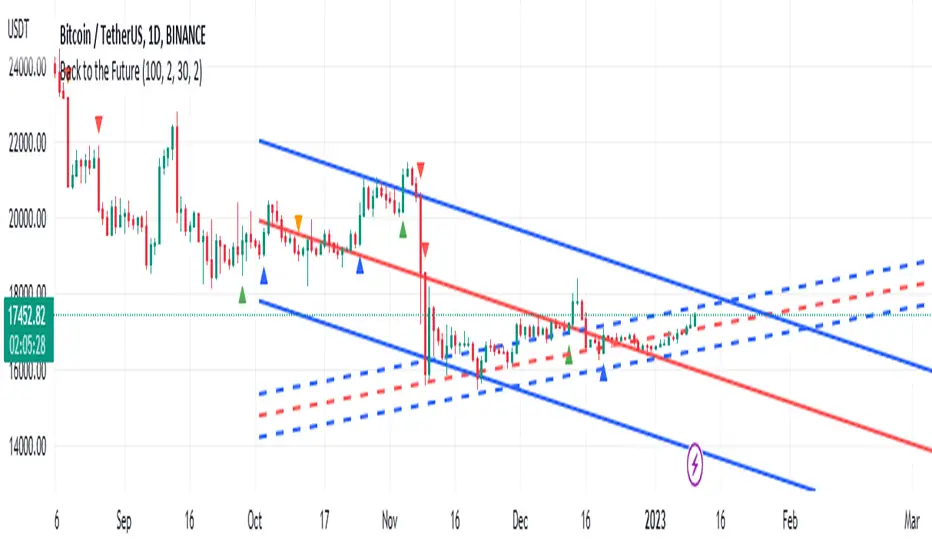
Hallo, very simple indicator in order to view trends
we have two linear regressions
one is the regular one that we know at length 100
the other one is lagging or past linear which is shorter at length 30
the basic idea is that when we combine both we can see trend of the current and the past linear when they cross each other and from this we can make signals.
Assuming that past shorter trend has the value of resistance or threshold values, so cross of current linear of those points can show if the trend is to buy or to sell by signals seen in the arrows .
So past and present mix and give us the future.
need to solve issue when market goes sideways but it easy to see how the trend look by the signals .
past linear seen in concave lines the current is the other one.
signals of positive trends are arrow up green or blue. negative trend red or orange arrow down
Skrip open-source
Dengan semangat TradingView yang sesungguhnya, pembuat skrip ini telah menjadikannya sebagai sumber terbuka, sehingga para trader dapat meninjau dan memverifikasi fungsinya. Salut untuk penulisnya! Meskipun Anda dapat menggunakannya secara gratis, perlu diingat bahwa penerbitan ulang kode ini tunduk pada Tata Tertib kami.
Pernyataan Penyangkalan
Informasi dan publikasi ini tidak dimaksudkan, dan bukan merupakan, saran atau rekomendasi keuangan, investasi, trading, atau jenis lainnya yang diberikan atau didukung oleh TradingView. Baca selengkapnya di Ketentuan Penggunaan.