OPEN-SOURCE SCRIPT
Bollinger Bands, RSI, and MA Strategy
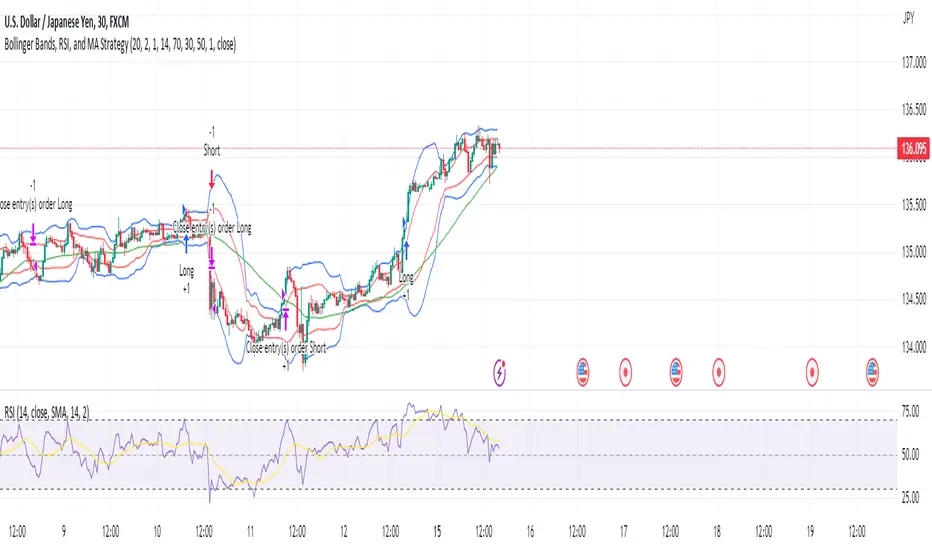
The "Bollinger Bands, RSI and MA Strategy" is a trend-following strategy that combines the Bollinger Bands indicator, the Relative Strength Index (RSI), and a moving average (MA). It aims to identify potential entry and exit points in the market based on price volatility, momentum, and trend.
The strategy uses two Bollinger Bands with different standard deviations to create price channels. The default settings for the Bollinger Bands are a length of 20 periods and a standard deviation of 2.0. The upper and lower bands of the Bollinger Bands serve as dynamic resistance and support levels, respectively.
The RSI indicator is employed to gauge the strength of price momentum.
The strategy also incorporates a 50-period moving average (MA) to help identify the overall trend direction. When the price is above the MA, it suggests an uptrend, and when the price is below the MA, it suggests a downtrend.
The entry conditions for long trades are when the RSI is above the overbought level and there is no contraction in the Bollinger Bands. For short trades, the entry conditions are when the RSI is below the oversold level and there is no contraction in the Bollinger Bands.
The exit conditions for long trades are when the RSI drops below the overbought level or when the price closes below the 50-period MA.
For short trades, the exit conditions are when the RSI goes above the oversold level or when the price closes above the 50-period MA.
The strategy generates alerts for potential long and short entry signals, as well as for exit signals when the specified conditions are met. These alerts can be used to receive notifications or take further actions, such as placing trades manually or using automated trading systems.
It is important to note that this strategy serves as a starting point and should be thoroughly backtested and validated with historical data before applying it to live trading. Additionally, it is recommended to consider risk management techniques, including setting appropriate stop-loss and take-profit levels, to effectively manage trades.
Skrip open-source
Dengan semangat TradingView yang sesungguhnya, pembuat skrip ini telah menjadikannya sebagai sumber terbuka, sehingga para trader dapat meninjau dan memverifikasi fungsinya. Salut untuk penulisnya! Meskipun Anda dapat menggunakannya secara gratis, perlu diingat bahwa penerbitan ulang kode ini tunduk pada Tata Tertib kami.
Pernyataan Penyangkalan
Informasi dan publikasi ini tidak dimaksudkan, dan bukan merupakan, saran atau rekomendasi keuangan, investasi, trading, atau jenis lainnya yang diberikan atau didukung oleh TradingView. Baca selengkapnya di Ketentuan Penggunaan.