[naoligo] 10x MA (H, D, W, M)
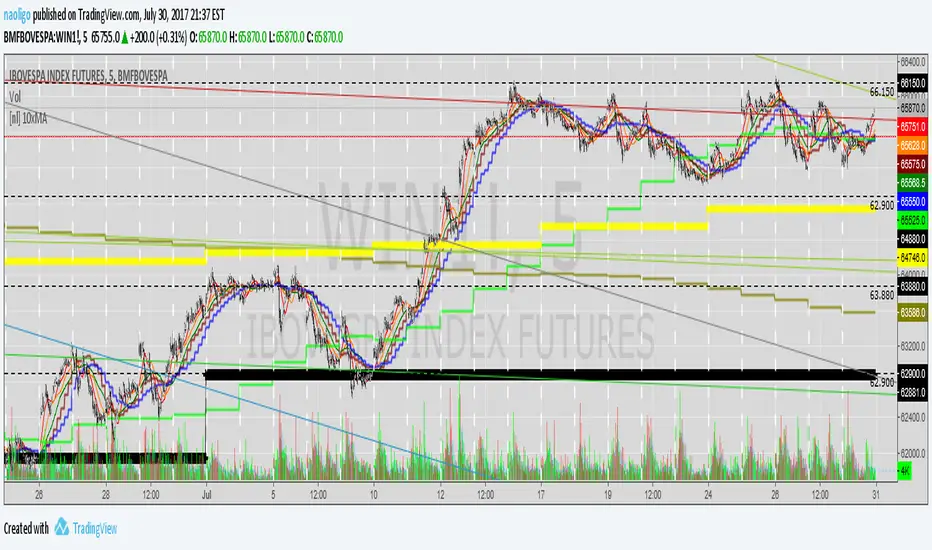
It will plot three Moving Averages based on current time interval and seven based on chosen periods by hour, day, week and month. You will be able to see where is, for example, a 50 days SMA when using a 5 minutes time interval chart. I find it very useful to analyze, in a snap, possible price ranges and enter/exit points. All reference values are from setups known and used by traders.
Cons: Use it wisely, because if you choose to plot all the 10 Moving Averages, he will consume a lot of the computer resources.
Enjoy!!
Edit: I forgot to mention that you can choose between EMA or SMA for each time interval, that are distributed in:
- 2x MA Hour;
- 2x MA Day;
- 2x MA Week;
- 1x MA Month.
I've tried to keep the code as simple as possible, so you can increase that number or modify the Moving Average that each time interval will use.
Peace!
Skrip open-source
Dengan semangat TradingView yang sesungguhnya, penulis skrip ini telah menjadikannya sumber terbuka, sehingga para trader dapat meninjau dan memverifikasi fungsinya. Hormat untuk penulisnya! Meskipun anda dapat menggunakannya secara gratis, ingatlah bahwa penerbitan ulang kode tersebut tunduk pada Tata Tertib kami.
Untuk akses cepat pada chart, tambahkan skrip ini ke favorit anda — pelajari lebih lanjut di sini.
Pernyataan Penyangkalan
Skrip open-source
Dengan semangat TradingView yang sesungguhnya, penulis skrip ini telah menjadikannya sumber terbuka, sehingga para trader dapat meninjau dan memverifikasi fungsinya. Hormat untuk penulisnya! Meskipun anda dapat menggunakannya secara gratis, ingatlah bahwa penerbitan ulang kode tersebut tunduk pada Tata Tertib kami.
Untuk akses cepat pada chart, tambahkan skrip ini ke favorit anda — pelajari lebih lanjut di sini.