OPEN-SOURCE SCRIPT
2x ATR Horizontal Rays
2x ATR Horizontal Rays Indicator
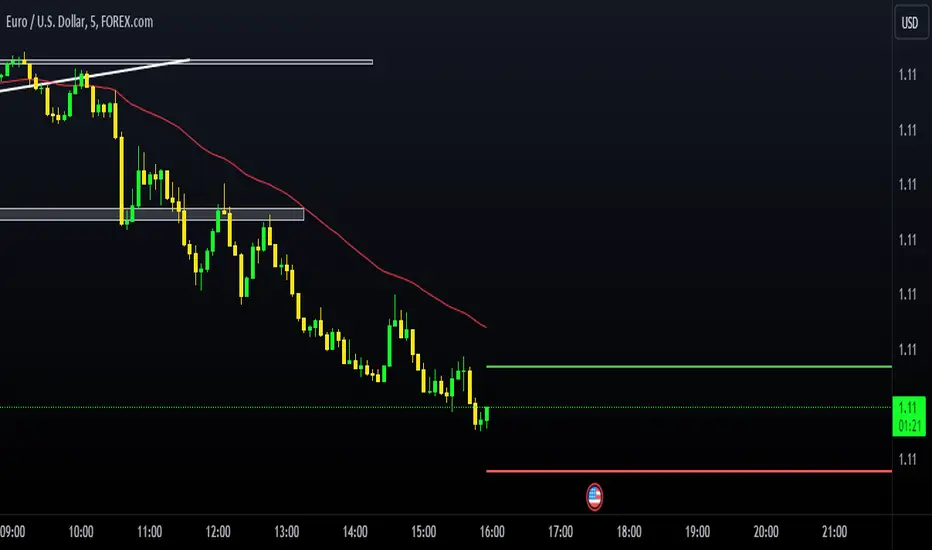
This script plots horizontal rays based on the 2x ATR (Average True Range) of the previous candle. It helps traders visualize key support and resistance levels by extending lines from the last candle's price, calculated with a 2x ATR multiplier. The indicator draws two lines:
Upper ATR Line: Positioned above the previous candle’s close by 2x the ATR value.
Lower ATR Line: Positioned below the previous candle’s close by 2x the ATR value.
Key Features:
Customizable ATR Length: Allows users to input their preferred ATR period to suit different market conditions.
Dynamic Horizontal Lines: The lines update with each new candle, giving traders a clear visual of volatility levels.
Extended Right Lines: The horizontal rays extend to the right, serving as potential zones for price reversals or breakouts.
This indicator is useful for traders looking to gauge market volatility and set target levels or stops based on historical price movements.
How to Use:
Add the indicator to your chart and adjust the ATR length in the settings.
Watch how the price interacts with the upper and lower ATR lines as potential zones for support, resistance, or trend continuation.
Happy trading!
Skrip open-source
Dengan semangat TradingView yang sesungguhnya, pembuat skrip ini telah menjadikannya sebagai sumber terbuka, sehingga para trader dapat meninjau dan memverifikasi fungsinya. Salut untuk penulisnya! Meskipun Anda dapat menggunakannya secara gratis, perlu diingat bahwa penerbitan ulang kode ini tunduk pada Tata Tertib kami.
Pernyataan Penyangkalan
Informasi dan publikasi ini tidak dimaksudkan, dan bukan merupakan, saran atau rekomendasi keuangan, investasi, trading, atau jenis lainnya yang diberikan atau didukung oleh TradingView. Baca selengkapnya di Ketentuan Penggunaan.