OPEN-SOURCE SCRIPT
Duo Multi-Time Period Charts
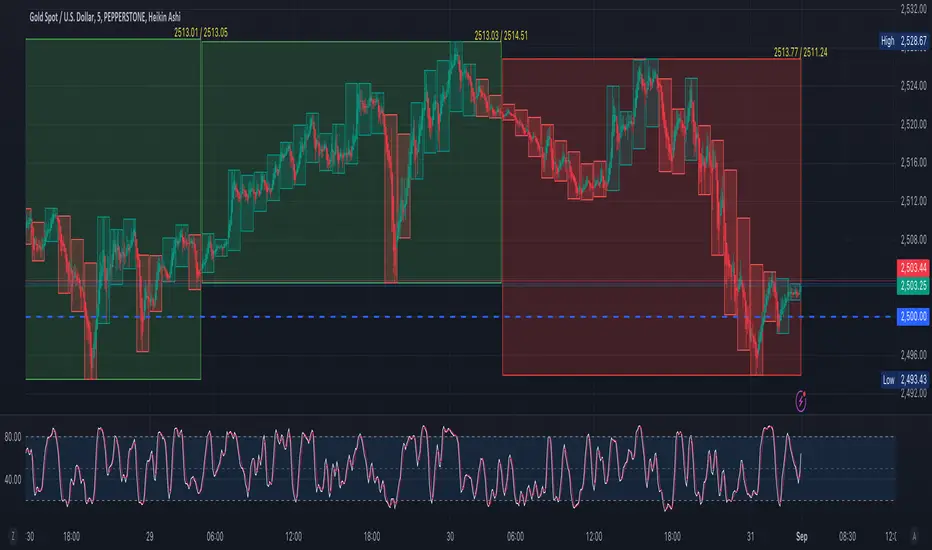
# Duo Multi-Time Period Charts
## Description
The Duo Multi-Time Period Charts indicator is a versatile tool designed to visualize price action across two different timeframes simultaneously. It overlays color-coded boxes on your chart, representing the price range for each period in both timeframes. This allows traders to easily identify trends, support, and resistance levels across multiple time horizons.
## Key Features
- Displays two user-defined timeframes (default: Daily and Weekly)
- Customizable calculation methods: High/Low Range, True Range, or Heikin Ashi Range
- Color-coded boxes for easy trend identification (bullish/bearish)
- Optional labels showing open and/or close prices
- Fully customizable colors for boxes and labels
## How It Works
1. The indicator creates boxes for each period in both selected timeframes.
2. Box colors change based on whether the close is higher (bullish) or lower (bearish) than the open.
3. Box heights are determined by the selected calculation method:
- High/Low Range: Uses the period's high and low
- True Range: Incorporates the previous close for more volatility representation
- Heikin Ashi Range: Uses a modified candlestick calculation for smoother trends
4. Optional labels display open and/or close prices for each period.
## Use Cases
- Multi-timeframe analysis: Compare short-term and long-term trends at a glance
- Support and resistance identification: Easily spot key levels across different timeframes
- Trend confirmation: Use the color-coding to confirm trend direction and strength
- Volatility assessment: Compare box sizes to gauge relative volatility between timeframes
## Customization
Users can customize various aspects of the indicator, including:
- Timeframes for analysis
- Calculation method for price ranges
- Color schemes for bullish and bearish periods in both timeframes
- Label content and colors
- Visibility options for boxes and labels
## Recommendation
For optimal clarity, it is recommended to enable price labels for only one timeframe. Displaying labels for both timeframes simultaneously may lead to cluttered and difficult-to-read charts, especially on shorter timeframes or when the two selected periods are close in duration.
This indicator is perfect for traders who want to incorporate multi-timeframe analysis into their trading strategy without cluttering their charts with multiple indicators. By following the label recommendation, users can maintain a clean chart while still benefiting from the multi-timeframe insights provided by the indicator.
Skrip open-source
Dengan semangat TradingView yang sesungguhnya, pembuat skrip ini telah menjadikannya sebagai sumber terbuka, sehingga para trader dapat meninjau dan memverifikasi fungsinya. Salut untuk penulisnya! Meskipun Anda dapat menggunakannya secara gratis, perlu diingat bahwa penerbitan ulang kode ini tunduk pada Tata Tertib kami.
Pernyataan Penyangkalan
Informasi dan publikasi ini tidak dimaksudkan, dan bukan merupakan, saran atau rekomendasi keuangan, investasi, trading, atau jenis lainnya yang diberikan atau didukung oleh TradingView. Baca selengkapnya di Ketentuan Penggunaan.