OPEN-SOURCE SCRIPT
PowerXYZ Strategy (PowerX Modified)
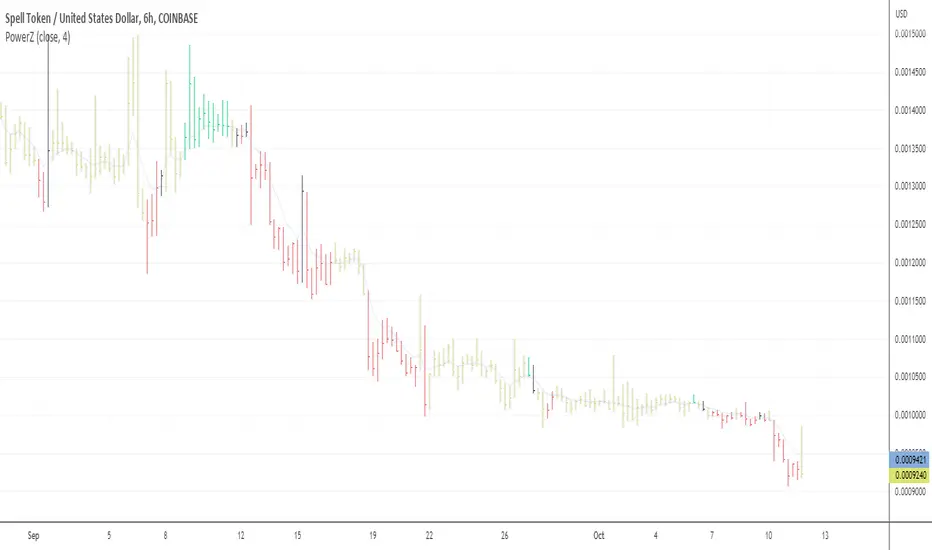
This script modifies the PowerX strategy in the following ways:
- there are two types of 'black' bars, yellow and black; the bars that are colored black indicate the flip of the RSI from positive to negative, and vise versa, while the signal is also near to green or red color; the close of these bars are a strong indication of support or resistance, and the previous closes behind these bars create S&D zones.
- compares the typical price to the 4-period smoothed moving average to generate yellow bars sooner at the end of trends.
- uses a signal line of > 49 and <= 49 instead of 50.
Yellow indicates that you should probably move your stop closer to the current price.
Black indicates that you should probably exit and look for a new entry, as it is a strong area of support or resistance.
Skrip open-source
Dengan semangat TradingView yang sesungguhnya, pembuat skrip ini telah menjadikannya sebagai sumber terbuka, sehingga para trader dapat meninjau dan memverifikasi fungsinya. Salut untuk penulisnya! Meskipun Anda dapat menggunakannya secara gratis, perlu diingat bahwa penerbitan ulang kode ini tunduk pada Tata Tertib kami.
Pernyataan Penyangkalan
Informasi dan publikasi ini tidak dimaksudkan, dan bukan merupakan, saran atau rekomendasi keuangan, investasi, trading, atau jenis lainnya yang diberikan atau didukung oleh TradingView. Baca selengkapnya di Ketentuan Penggunaan.