OPEN-SOURCE SCRIPT
TEMA Cross on Renko Candles
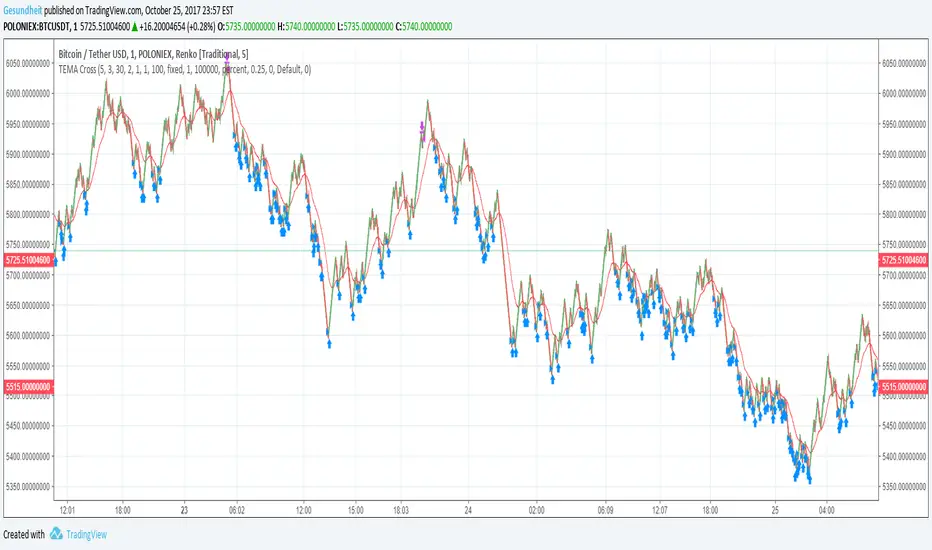
Renko candles filter out noise by plotting a fixed change in price rather than a fixed time frame.
Strategies like MACD or MA cross can give a lot of false signals when the price is wavy, but not actually going anywhere. This is especially a problem with small time frames.
Since it's so easy to identify trends on a Renko plot, this strategy uses a simple moving average cross idea. Instead of an EMA, we use a TEMA (triple exponential moving average) because that version does not lag as much.
We also will avoid buying when the price is above a longer-term smoothed moving average. This means we will hopefully reduce bags, but we will also miss some trades.
Also included are
avg_protection -- if >0 only buy when it will bring down our average price, else buy whenever the TEMA crosses over the short-term SMA
gain_protection -- if >0 only sell when we meet out min_gain %, otherwise sell whenever TEMA crosses under the short-term SMA
I've been setting my Renko candles to a fixed range instead of ATR, and I use increments of roughly 0.1% in the example chart.
Skrip open-source
Dengan semangat TradingView yang sesungguhnya, pembuat skrip ini telah menjadikannya sebagai sumber terbuka, sehingga para trader dapat meninjau dan memverifikasi fungsinya. Salut untuk penulisnya! Meskipun Anda dapat menggunakannya secara gratis, perlu diingat bahwa penerbitan ulang kode ini tunduk pada Tata Tertib kami.
Pernyataan Penyangkalan
Informasi dan publikasi ini tidak dimaksudkan, dan bukan merupakan, saran atau rekomendasi keuangan, investasi, trading, atau jenis lainnya yang diberikan atau didukung oleh TradingView. Baca selengkapnya di Ketentuan Penggunaan.