OPEN-SOURCE SCRIPT
Higher Timeframe Separator
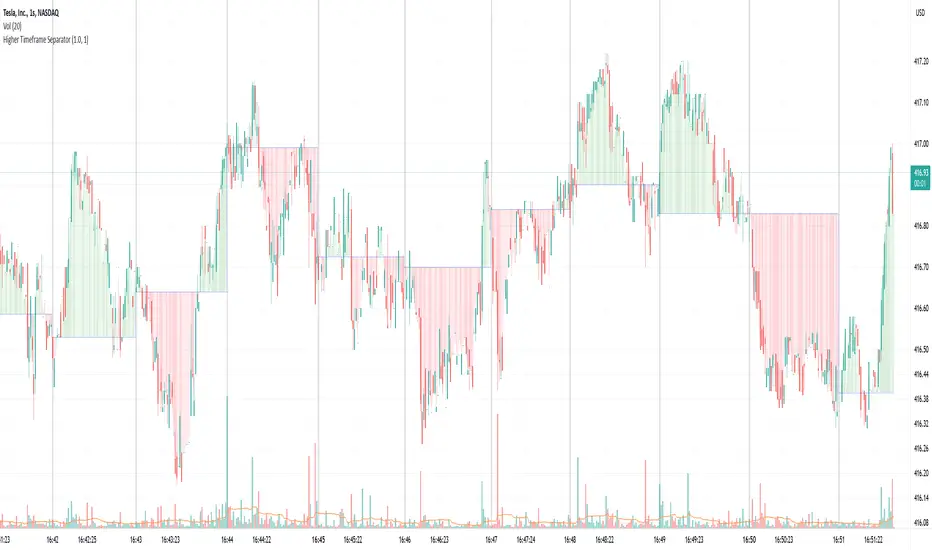
This script helps visually identify when a higher timeframe candle starts by drawing a vertical line. It also shades the area above or below the opening price, making it easier to track price movement relative to the higher timeframe.
Why It's Useful
If you use multiple timeframes, this indicator provides a clear visual reference for where the price is relative to the higher timeframe. This is much more convenient than constantly switching between charts. You can see in the screenshot below how much clearer the price action becomes when the indicator is enabled:

Additional Benefit
If you trade on a lower timeframe and notice that the number of bars between separators is inconsistent, it means there weren’t enough trades during that period—indicating low liquidity. Illiquid instruments can be riskier to trade. For example, observe how the vertical lines on the left side of the image below are densely packed:

Why It's Useful
If you use multiple timeframes, this indicator provides a clear visual reference for where the price is relative to the higher timeframe. This is much more convenient than constantly switching between charts. You can see in the screenshot below how much clearer the price action becomes when the indicator is enabled:
Additional Benefit
If you trade on a lower timeframe and notice that the number of bars between separators is inconsistent, it means there weren’t enough trades during that period—indicating low liquidity. Illiquid instruments can be riskier to trade. For example, observe how the vertical lines on the left side of the image below are densely packed:
Skrip open-source
Dengan semangat TradingView yang sesungguhnya, pembuat skrip ini telah menjadikannya sebagai sumber terbuka, sehingga para trader dapat meninjau dan memverifikasi fungsinya. Salut untuk penulisnya! Meskipun Anda dapat menggunakannya secara gratis, perlu diingat bahwa penerbitan ulang kode ini tunduk pada Tata Tertib kami.
Pernyataan Penyangkalan
Informasi dan publikasi ini tidak dimaksudkan, dan bukan merupakan, saran atau rekomendasi keuangan, investasi, trading, atau jenis lainnya yang diberikan atau didukung oleh TradingView. Baca selengkapnya di Ketentuan Penggunaan.