PROTECTED SOURCE SCRIPT
Diupdate CandlestickPatterns
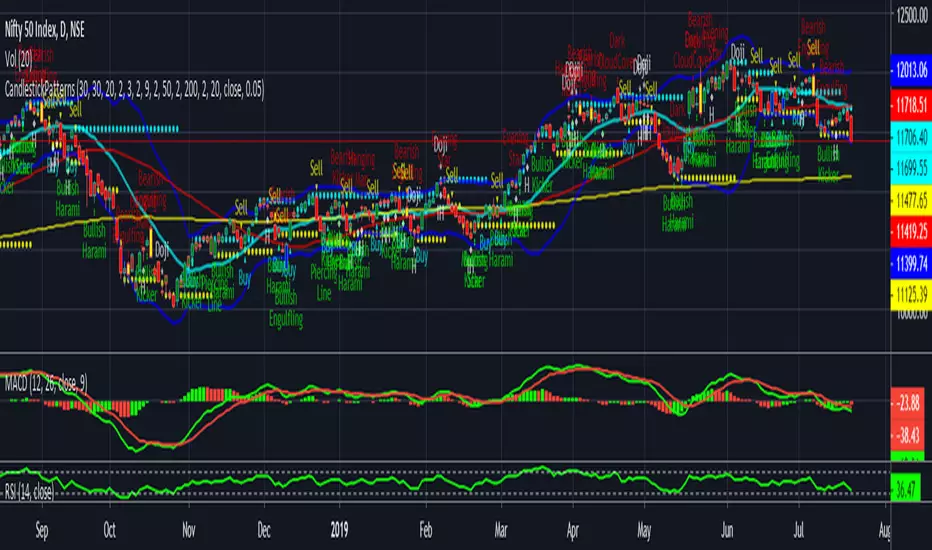
If moving average SMA (green line) crosses above SMA (red line) is uptrend , stock price will move up gradually. If suppose moving average SMA (green line) crosses below SMA (red line) is downtrend, stock price will move down. Also please validate with MACD & RSI for reference will get more clarification.
The default script have:
1) Bollinger Bands
2) Moving Average
3) Buy & Sell Signals
4) Engulfing patterns (like Doji , Bearish Harami, Bullish Harami, Bearish Engulfing , Bullish Engulfing , Piercing Line, Bullish Belt, Bullish Kicker, and Bearish Kicker)
The Piercing Line, Bullish Belt, and the Kickers will usually show up better in the daily charts.
Catatan Rilis
If moving average SMA (green line) crosses above SMA (red line) is uptrend , stock price will move up gradually. If suppose moving average SMA (green line) crosses below SMA (red line) is downtrend, stock price will move down. Also please validate with MACD & RSI for reference will get more clarification. The default script have:
1) Bollinger Bands
2) Moving Average
3) Buy & Sell Signals
4) Engulfing patterns (like Doji , Bearish Harami, Bullish Harami, Bearish Engulfing , Bullish Engulfing , Piercing Line, Bullish Belt, Bullish Kicker, and Bearish Kicker)
The Piercing Line, Bullish Belt, and the Kickers will usually show up better in the daily charts.
#update only buy & sell signal identification with new triangle symbol.
Catatan Rilis
++Engulfing Colour ChangeCatatan Rilis
Update Support and Resistance are added.support--> Orange Colour
Resistance--> Aqua Colour
Catatan Rilis
#Moving Averages SMA50 & SMA200 are added.Catatan Rilis
#Colour DetailsSMA3--> lime
SMA9--> red
SMA20--> green
SMA50--> fuchsia
SMA200--> orange
Support--> yellow
Resistance--> aqua
Catatan Rilis
## 50days and 200days SMA color change 50days SMA--> orange
200days SMA--> yellow
Catatan Rilis
##Catatan Rilis
#20 days MA colour--> AquaCatatan Rilis
Update with Support and ResistanceCatatan Rilis
colour change Skrip terproteksi
Skrip ini diterbitkan sebagai sumber tertutup. Namun, Anda dapat menggunakannya dengan bebas dan tanpa batasan apa pun – pelajari lebih lanjut di sini.
Pernyataan Penyangkalan
Informasi dan publikasi ini tidak dimaksudkan, dan bukan merupakan, saran atau rekomendasi keuangan, investasi, trading, atau jenis lainnya yang diberikan atau didukung oleh TradingView. Baca selengkapnya di Ketentuan Penggunaan.
Skrip terproteksi
Skrip ini diterbitkan sebagai sumber tertutup. Namun, Anda dapat menggunakannya dengan bebas dan tanpa batasan apa pun – pelajari lebih lanjut di sini.
Pernyataan Penyangkalan
Informasi dan publikasi ini tidak dimaksudkan, dan bukan merupakan, saran atau rekomendasi keuangan, investasi, trading, atau jenis lainnya yang diberikan atau didukung oleh TradingView. Baca selengkapnya di Ketentuan Penggunaan.