OPEN-SOURCE SCRIPT
Diupdate Relative chart analysis using arithmetic operators
Relative chart analysis using arithmetic operators.
Catatan Rilis
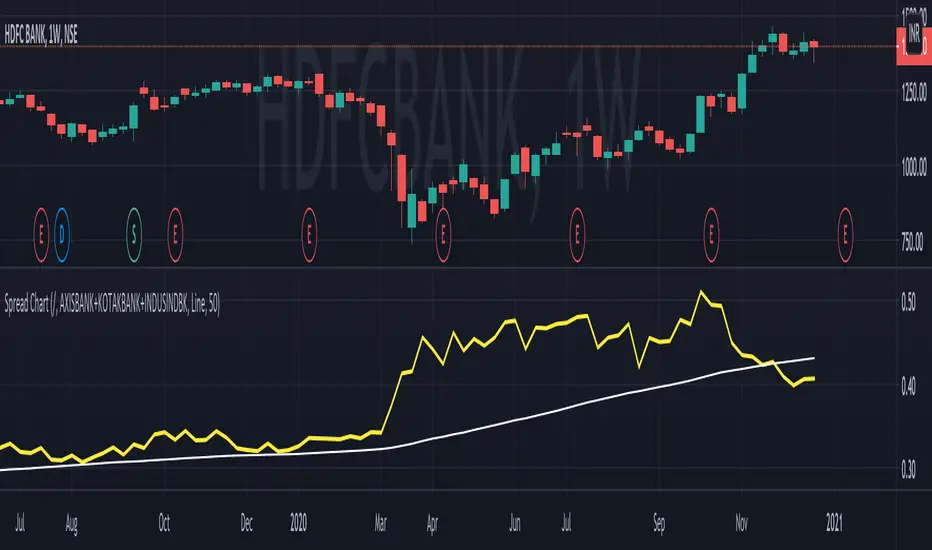
- Now line plots are available and the default option
- The 50 Period Moving Average is also plotted by default
Usage:
On can plot a combination of number of mathematical operators. The input source, can itself also be a combination of different scrips. For example, in this example, we compare (divide / ) HDFCBANK with a "synthetic benchmark" of other competing private banks by combining (AXIS + KOTAK + INDUSIND) in the input.
Skrip open-source
Dengan semangat TradingView yang sesungguhnya, pembuat skrip ini telah menjadikannya sebagai sumber terbuka, sehingga para trader dapat meninjau dan memverifikasi fungsinya. Salut untuk penulisnya! Meskipun Anda dapat menggunakannya secara gratis, perlu diingat bahwa penerbitan ulang kode ini tunduk pada Tata Tertib kami.
Pernyataan Penyangkalan
Informasi dan publikasi ini tidak dimaksudkan, dan bukan merupakan, saran atau rekomendasi keuangan, investasi, trading, atau jenis lainnya yang diberikan atau didukung oleh TradingView. Baca selengkapnya di Ketentuan Penggunaan.