MTF BB%+ [Overlay] [Intromoto]
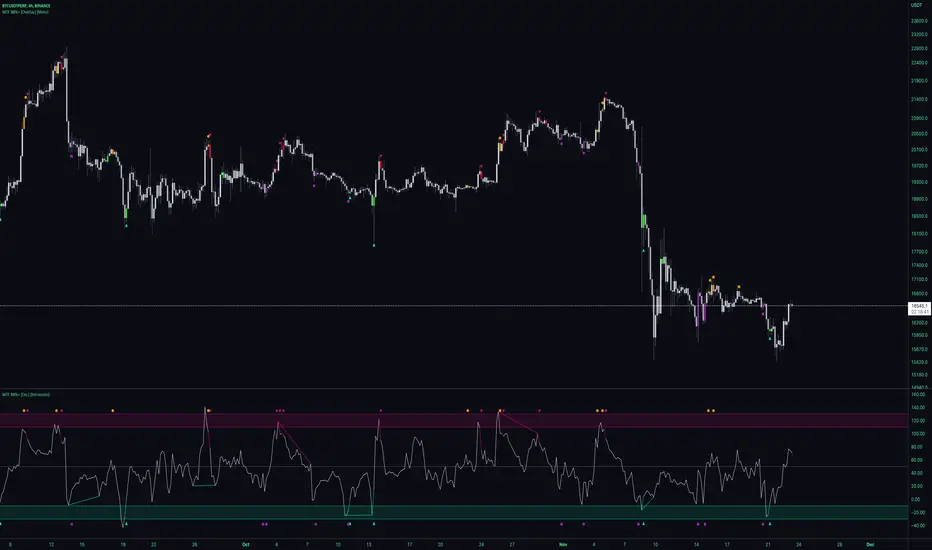
Plotshapes are printed when exiting extremes of the deviations, back towards the mean.
Arrows indicate an increased likelihood of price reverting direction. Red arrow =bearish, green arrow = bullish. Dots below candles = bullish, above candles = bearish.
Dots on the top and bottom of the candles show a sub level of reversion that would be perhaps less extreme than when price reenters the norm from the normal standard deviation.
Users can also change the timeframe of the indicator for high time frame signals.
Barcolors for plotshapes included.
DM for access
Thanks
Skrip hanya-undangan
Hanya pengguna yang disetujui oleh penulis yang dapat mengakses skrip ini. Anda harus meminta dan mendapatkan izin untuk menggunakannya. Izin ini biasanya diberikan setelah pembayaran. Untuk detail lebih lanjut, ikuti petunjuk penulis di bawah ini atau hubungi Intromoto secara langsung.
TradingView TIDAK menyarankan untuk membayar atau menggunakan skrip kecuali anda benar-benar percaya kepada pembuatnya dan memahami cara kerjanya. Anda juga dapat menemukan alternatif sumber terbuka yang gratis di skrip komunitas kami.
Instruksi penulis
Peringatan: harap baca panduan kami untuk skrip khusus undangan sebelum meminta akses.
Follow on Twitter for updates.
One time fee, no subscription
twitter.com/IntroMoto
Pernyataan Penyangkalan
Skrip hanya-undangan
Hanya pengguna yang disetujui oleh penulis yang dapat mengakses skrip ini. Anda harus meminta dan mendapatkan izin untuk menggunakannya. Izin ini biasanya diberikan setelah pembayaran. Untuk detail lebih lanjut, ikuti petunjuk penulis di bawah ini atau hubungi Intromoto secara langsung.
TradingView TIDAK menyarankan untuk membayar atau menggunakan skrip kecuali anda benar-benar percaya kepada pembuatnya dan memahami cara kerjanya. Anda juga dapat menemukan alternatif sumber terbuka yang gratis di skrip komunitas kami.
Instruksi penulis
Peringatan: harap baca panduan kami untuk skrip khusus undangan sebelum meminta akses.
Follow on Twitter for updates.
One time fee, no subscription
twitter.com/IntroMoto