OPEN-SOURCE SCRIPT
3M-10Y Yield Spread
3M-10Y Yield Spread Indicator Description
What It Is:
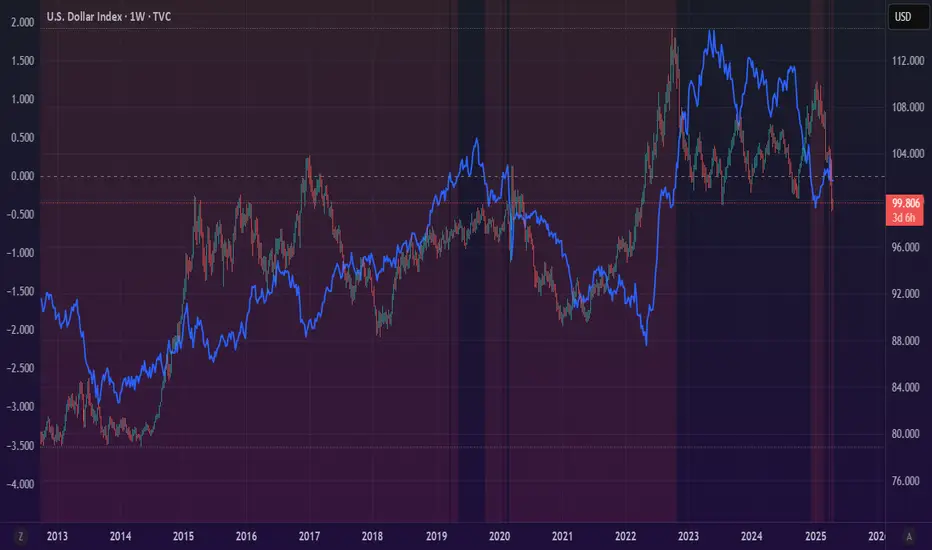
This indicator calculates the difference (spread) between the 3-month and 10-year US Treasury yields, plotted as a line with a zero reference. The background turns red when the spread inverts (falls below zero), signaling when the 3-month yield exceeds the 10-year yield.
What It Helps Understand:
Economic Health: An inverted yield curve (spread < 0) often predicts recessions, as it reflects market expectations of future economic slowdown, typically preceding downturns by 6-18 months.
Fed Policy Impact: Fed rate hikes can push short-term yields (like the 3-month) higher, potentially causing inversion if long-term yields (10-year) don’t rise as much due to growth concerns. Conversely, Fed rate cuts can lower short-term yields, steepening the curve (spread > 0), signaling economic stimulus or recovery expectations.
What It Is:
This indicator calculates the difference (spread) between the 3-month and 10-year US Treasury yields, plotted as a line with a zero reference. The background turns red when the spread inverts (falls below zero), signaling when the 3-month yield exceeds the 10-year yield.
What It Helps Understand:
Economic Health: An inverted yield curve (spread < 0) often predicts recessions, as it reflects market expectations of future economic slowdown, typically preceding downturns by 6-18 months.
Fed Policy Impact: Fed rate hikes can push short-term yields (like the 3-month) higher, potentially causing inversion if long-term yields (10-year) don’t rise as much due to growth concerns. Conversely, Fed rate cuts can lower short-term yields, steepening the curve (spread > 0), signaling economic stimulus or recovery expectations.
Skrip open-source
Dengan semangat TradingView yang sesungguhnya, pembuat skrip ini telah menjadikannya sebagai sumber terbuka, sehingga para trader dapat meninjau dan memverifikasi fungsinya. Salut untuk penulisnya! Meskipun Anda dapat menggunakannya secara gratis, perlu diingat bahwa penerbitan ulang kode ini tunduk pada Tata Tertib kami.
Pernyataan Penyangkalan
Informasi dan publikasi ini tidak dimaksudkan, dan bukan merupakan, saran atau rekomendasi keuangan, investasi, trading, atau jenis lainnya yang diberikan atau didukung oleh TradingView. Baca selengkapnya di Ketentuan Penggunaan.