OPEN-SOURCE SCRIPT
Diupdate (mab) ATR Band
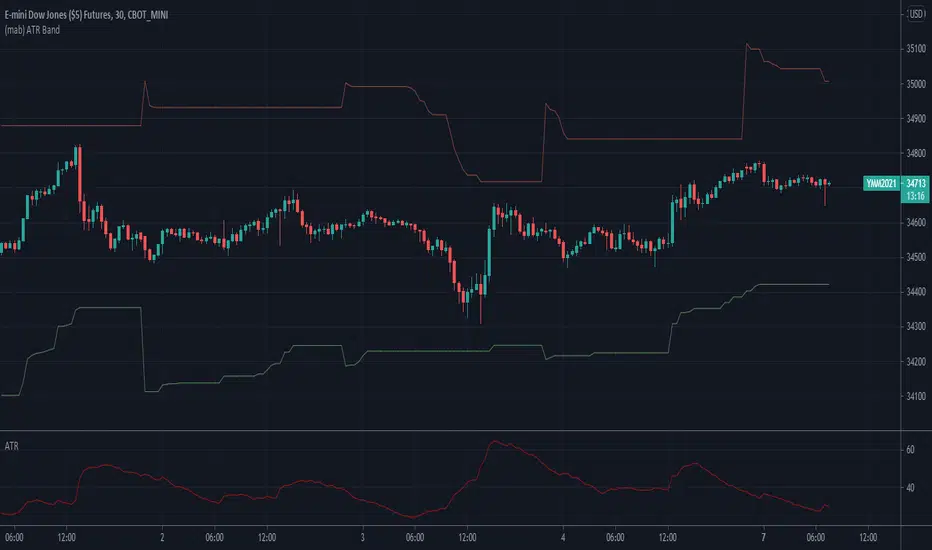
Simple ATR band as overlay on price chart.
Catatan Rilis
This updated version is more advanced. It plots a simple ATR band on daily and higher time frames. On intraday charts it can plot a dynamic band that takes the previous days ATR as starting point. At new lows it lowers the upper band to the new low plus the previous days ATR. At new highs it rises the lower band to the new high minus the previous days ATR.Catatan Rilis
This update enhances the (mab) ATR Band indicator with multi time frame capabilities. If "Floating daily ATR on intraday charts" is enabled, it shows the previous days ATR value as a starting point at the start of the session on intraday charts. At new lows it lowers the upper band to the new low plus the previous days ATR. At new highs it rises the lower band to the new high minus the previous days ATR.Similarly if "Floating weekly/monthly ATR on daily/weekly charts" is enabled, it shows the previous weeks ATR as starting point on daily charts and the previous months ATR on weekly charts. At new lows it lowers the upper band to the new low plus the previous weeks/moths ATR. At new highs it rises the lower band to the new high minus the previous weeks/months ATR.
Skrip open-source
Dengan semangat TradingView yang sesungguhnya, pembuat skrip ini telah menjadikannya sebagai sumber terbuka, sehingga para trader dapat meninjau dan memverifikasi fungsinya. Salut untuk penulisnya! Meskipun Anda dapat menggunakannya secara gratis, perlu diingat bahwa penerbitan ulang kode ini tunduk pada Tata Tertib kami.
Pernyataan Penyangkalan
Informasi dan publikasi ini tidak dimaksudkan, dan bukan merupakan, saran atau rekomendasi keuangan, investasi, trading, atau jenis lainnya yang diberikan atau didukung oleh TradingView. Baca selengkapnya di Ketentuan Penggunaan.