OPEN-SOURCE SCRIPT
CISD Trend Candle + MACD Signal
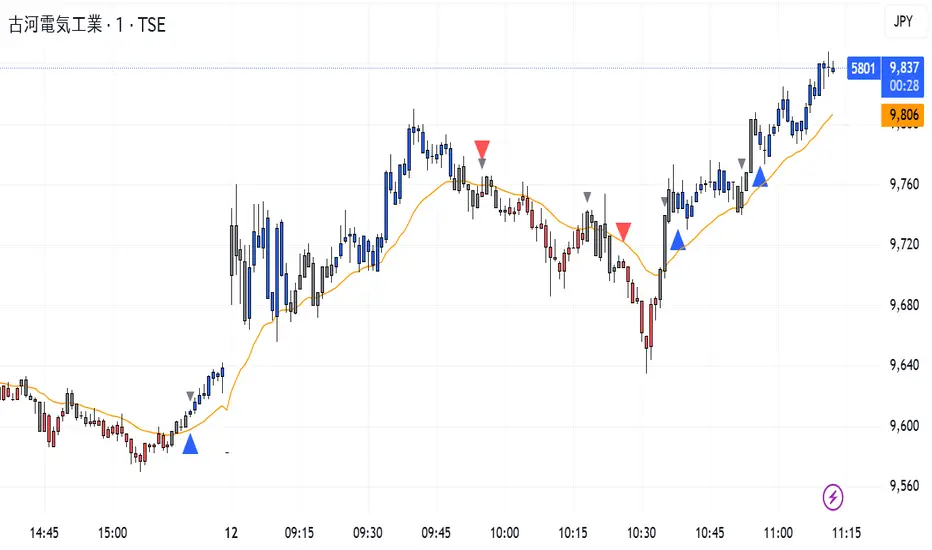
This custom TradingView indicator combines trend-based candle coloring with MACD reversal detection to generate clear entry and exit signals:
🔷 Blue triangle (Buy): Appears when the candles confirm an uptrend (e.g., 5 consecutive closes above 21 EMA) and no long position is currently held.
🔴 Red triangle (Sell): Appears when the candles confirm a downtrend (e.g., 5 consecutive closes below 21 EMA) and no short position is currently held.
⚪ Gray triangle (Exit):
If in a long position, it shows when the candle turns neutral (gray) and the MACD crosses down (bearish signal), or the trend turns red.
If in a short position, it shows when the candle turns neutral and the MACD crosses up (bullish signal), or the trend turns blue.
🟠 Orange line: 21-period EMA used for trend validation.
This logic prevents premature entries and provides structured exit points, aiming to avoid false signals in choppy markets.
Skrip open-source
Dengan semangat TradingView yang sesungguhnya, pembuat skrip ini telah menjadikannya sebagai sumber terbuka, sehingga para trader dapat meninjau dan memverifikasi fungsinya. Salut untuk penulisnya! Meskipun Anda dapat menggunakannya secara gratis, perlu diingat bahwa penerbitan ulang kode ini tunduk pada Tata Tertib kami.
Pernyataan Penyangkalan
Informasi dan publikasi ini tidak dimaksudkan, dan bukan merupakan, saran atau rekomendasi keuangan, investasi, trading, atau jenis lainnya yang diberikan atau didukung oleh TradingView. Baca selengkapnya di Ketentuan Penggunaan.