OPEN-SOURCE SCRIPT
Diupdate DTB

Dynamic Trendline Bands with Buy/Sell Pressure Detection
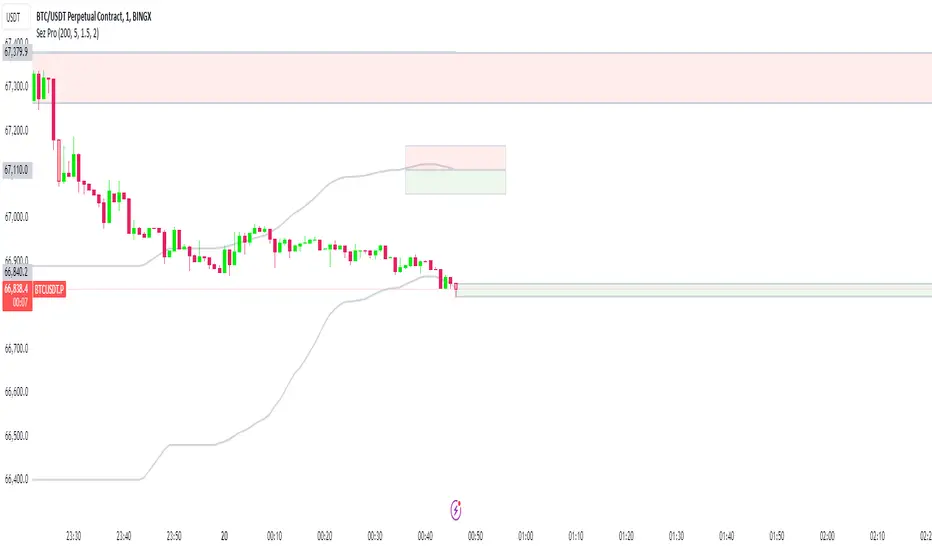
This indicator provides a comprehensive analysis of price movements by incorporating smoothed high and low bands, a midline, and the detection of buying and selling pressure. It is designed to help traders identify key support and resistance levels as well as potential buy and sell signals.
**Features:**
- **Smooth High and Low Bands:** Based on the highest high and lowest low over a specified period, smoothed using a simple moving average (SMA) to reduce noise and enhance clarity.
- **Midline:** The average of the smoothed high and low bands, providing a central reference point for price movements.
- **Buying and Selling Pressure Detection:** Highlights candles with significant buying or selling pressure, indicated by light green for buying pressure and light red for selling pressure. This is determined based on volume thresholds and price movement.
- **Trendlines:** Dynamic trendlines are drawn based on recent highs and lows, helping to visualize the current trend direction.
**How to Use:**
1. **High-Low Bands:** Use these bands to identify key support and resistance levels.
2. **Midline:** Monitor the midline for potential mean reversion trades.
3. **Buying/Selling Pressure Candles:** Look for candles highlighted in light green or red to identify potential buy or sell signals.
4. **Trendlines:** Follow the dynamic trendlines to understand the direction of the current trend.
**Inputs:**
- **Length:** Number of bars to consider for calculating the highest high and lowest low (default: 200).
- **Smooth Length:** Period for the simple moving average to smooth the high and low bands (default: 10).
- **Volume Threshold Multiplier:** Multiplier for the average volume to detect significant buying or selling pressure (default: 1.5).
This indicator is suitable for all timeframes and can be used in conjunction with other technical analysis tools to enhance your trading strategy.
Catatan Rilis
New designSkrip open-source
Dengan semangat TradingView yang sesungguhnya, pembuat skrip ini telah menjadikannya sebagai sumber terbuka, sehingga para trader dapat meninjau dan memverifikasi fungsinya. Salut untuk penulisnya! Meskipun Anda dapat menggunakannya secara gratis, perlu diingat bahwa penerbitan ulang kode ini tunduk pada Tata Tertib kami.
Pernyataan Penyangkalan
Informasi dan publikasi ini tidak dimaksudkan, dan bukan merupakan, saran atau rekomendasi keuangan, investasi, trading, atau jenis lainnya yang diberikan atau didukung oleh TradingView. Baca selengkapnya di Ketentuan Penggunaan.
Skrip open-source
Dengan semangat TradingView yang sesungguhnya, pembuat skrip ini telah menjadikannya sebagai sumber terbuka, sehingga para trader dapat meninjau dan memverifikasi fungsinya. Salut untuk penulisnya! Meskipun Anda dapat menggunakannya secara gratis, perlu diingat bahwa penerbitan ulang kode ini tunduk pada Tata Tertib kami.
Pernyataan Penyangkalan
Informasi dan publikasi ini tidak dimaksudkan, dan bukan merupakan, saran atau rekomendasi keuangan, investasi, trading, atau jenis lainnya yang diberikan atau didukung oleh TradingView. Baca selengkapnya di Ketentuan Penggunaan.