PROTECTED SOURCE SCRIPT
Volume Bubbles Delta Coloring Classic V1.0
OVERVIEW
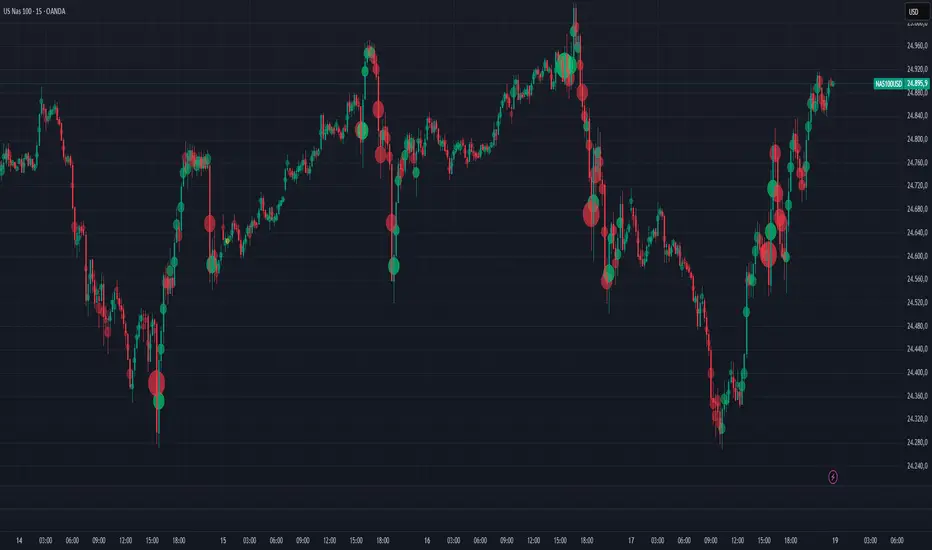
Bubbles Volume — Classic plots volume bubbles directly on the price chart. Bubble size scales with normalized volume, helping to visualize where trading activity concentrates. Optional heatmap coloring and significant-volume levels are included.
HOW IT WORKS
• Normalizes volume by its standard deviation to highlight unusually high participation.
• Draws circles ("bubbles") whose size corresponds to the normalized volume.
• Optional heatmap gradient emphasizes different volume regimes.
• Optional significant levels display labels or horizontal lines at the highest-volume bars.
INPUTS
• Bubbles / Threshold — Enable bubbles and set volume sensitivity.
• HeatMap — Enable gradient coloring by volume intensity.
• Significant Levels — Display labels or lines for the strongest volume bars.
• Levels Qty — Limit the number of labels or lines to display.
USE CASES
• Identify bars with unusually high trading activity.
• Spot reaction zones where large participants may have acted.
• Complement to price structure and trend analysis.
NOTES
• Uses chart volume only — not bid/ask orderflow.
• Visualization and educational tool, not a signal generator.
• Reduce visible bars if performance slows down.
CREDITS
Original concept by BigBeluga. Published under CC BY-NC-SA 4.0 license.
This is the unmodified, reference version.
Skrip terproteksi
Skrip ini diterbitkan sebagai sumber tertutup. Namun, Anda dapat menggunakannya dengan bebas dan tanpa batasan apa pun – pelajari lebih lanjut di sini.
Pernyataan Penyangkalan
Informasi dan publikasi ini tidak dimaksudkan, dan bukan merupakan, saran atau rekomendasi keuangan, investasi, trading, atau jenis lainnya yang diberikan atau didukung oleh TradingView. Baca selengkapnya di Ketentuan Penggunaan.