PROTECTED SOURCE SCRIPT
Diupdate Uptrick: Adaptive Volatility Oscillator
### **Overview and Purpose**
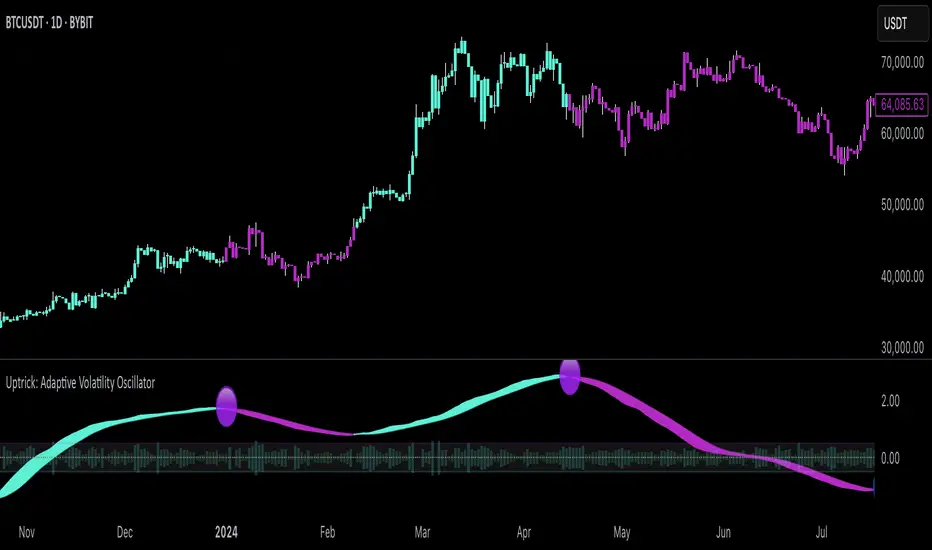
The **"Uptrick: Adaptive Volatility Oscillator"** is a sophisticated technical analysis tool designed to identify and visualize volatility trends within the financial markets. This indicator is particularly useful for traders and analysts who seek to understand the market's underlying momentum by analyzing the relationship between volume and price changes. It adapts to changing market conditions, providing a dynamic way to gauge overbought and oversold levels, identify potential reversals, and track the strength of market movements.
### **Core Components**
1. **Volume Oscillator Calculation**:
- **Purpose**: The volume oscillator is at the heart of this indicator. It measures the directional momentum of volume by comparing current volume levels with those of previous periods.
- **How It Works**: The oscillator calculates the difference between current and past volume levels, determining whether the market is experiencing buying or selling pressure. This is normalized to ensure the oscillator's values are comparable across different time frames and market conditions.
- **Normalized Oscillator**: To make the oscillator's readings more meaningful, the values are normalized by adjusting for standard deviation over a long period (150 bars). This step helps in smoothing out the noise and highlights significant shifts in market activity.
2. **Adaptive Filter Calculation**:
- **Purpose**: The adaptive filter refines the raw oscillator data to create a smoother signal that is responsive to market changes without being overly reactive to minor fluctuations.
- **Adaptive Coefficient**: This coefficient, set by the user, controls the sensitivity of the filter. A higher coefficient makes the filter more sensitive to recent changes, while a lower coefficient gives more weight to past data.
- **How It Works**: The filter applies a weighted average to the oscillator values, where recent data is given more importance. This creates a dynamic signal that adapts to the market's changing conditions, highlighting significant trends and potential turning points.
3. **Signal Line**:
- **Purpose**: The signal line serves as a benchmark for the filtered oscillator values, providing a basis for comparison to determine the current trend's strength.
- **Smoothing**: The signal line is smoothed over a user-defined period to ensure it represents the underlying trend accurately. This smoothing process reduces the noise and allows traders to focus on the more meaningful movements.
4. **Overbought/Oversold Zones**:
- **Purpose**: These zones help traders identify when the market is potentially overstretched and due for a correction. They are crucial for timing entry and exit points.
- **Thresholds**: The user-defined thresholds represent levels where the oscillator values are considered extreme. When the oscillator crosses these levels, it signals that the market may be overbought or oversold.
- **Visual Cues**: The indicator plots these zones on the chart, making it easy for traders to see when the market enters these critical areas. This visualization is vital for spotting potential reversals or continuations in the trend.
5. **Histogram Visualization**:
- **Purpose**: The histogram provides a visual representation of the volatility in the market, making it easier to interpret the oscillator's readings.
- **Color Coding**: The histogram bars are color-coded based on the filtered oscillator's relationship with the signal line. Green bars indicate a positive momentum (bullish), while red bars indicate negative momentum (bearish). This color-coding helps traders quickly assess the market's current state.
- **Intensity of Movement**: The height and color intensity of the histogram bars reflect the strength of the underlying trend. Higher bars with more intense colors signify stronger market movements.
6. **Buy and Sell Signals**:
- **Purpose**: The indicator provides explicit buy and sell signals based on the oscillator's interaction with the signal line and the overbought/oversold thresholds.
- **Buy Signal**: A buy signal is generated when the filtered oscillator crosses above the signal line while in the oversold zone. This suggests that the market may be reversing upwards from an oversold condition.
- **Sell Signal**: Conversely, a sell signal is generated when the filtered oscillator crosses below the signal line while in the overbought zone, indicating a potential downward reversal from an overbought condition.
- **Visual Representation**: These signals are visually represented on the chart with specific symbols, such as green circles for buy signals and red circles for sell signals, making them easy to spot.
### **Usefulness and Applications**
1. **Trend Identification**:
- The indicator is highly effective in identifying the current trend and its strength. By analyzing the relationship between the oscillator and the signal line, traders can determine whether the market is in an uptrend, downtrend, or ranging. The adaptive nature of the filter ensures that the trend signals remain relevant even as market conditions change.
2. **Volatility Analysis**:
- Understanding market volatility is crucial for risk management and strategy development. This indicator provides a clear view of how volatility is evolving, helping traders adjust their strategies accordingly. For example, higher volatility might suggest the need for tighter stop losses or more conservative position sizes.
3. **Overbought/Oversold Detection**:
- The overbought and oversold zones are essential for identifying potential reversal points. These zones can be used to time entries and exits, particularly in markets that are prone to mean reversion. The visual cues provided by the indicator make it easier to spot when the market might be overstretched.
4. **Adaptive Filtering**:
- The adaptive filter is a significant advantage of this indicator. Unlike static filters, which might lag or react too quickly to noise, the adaptive filter adjusts to the market's pace. This makes the indicator versatile, suitable for different market conditions, and less prone to giving false signals.
5. **Visual Clarity**:
- The indicator is designed with visual clarity in mind. The color-coded bars and overbought/oversold zones make it easy to interpret the market's current state at a glance. This is particularly useful for traders who rely on quick decision-making or need to monitor multiple assets simultaneously.
6. **Customizability**:
- The indicator offers several user inputs that allow traders to customize it according to their trading style and market of interest. This includes the length of the volume period, the sensitivity of the adaptive filter, and the thresholds for overbought/oversold conditions. Such flexibility makes it a valuable tool for both short-term traders and long-term investors.
### **Conclusion**
The "Uptrick: Adaptive Volatility Oscillator" is a powerful and versatile indicator that blends volume analysis with adaptive filtering to provide a nuanced view of market trends and volatility. Its ability to identify overbought and oversold conditions, coupled with its adaptive nature, makes it an indispensable tool for traders looking to gain an edge in the markets. Whether you're aiming to spot trend reversals, confirm the strength of ongoing trends, or manage risk through volatility analysis, this indicator offers the insights needed to make informed trading decisions. Its clear visual signals and customizable parameters further enhance its utility, making it suitable for a wide range of trading strategies and market environments.
Catatan Rilis
Adjusted color schemeUpdated to version 6
Skrip terproteksi
Skrip ini diterbitkan sebagai sumber tertutup. Namun, Anda dapat menggunakannya dengan bebas dan tanpa batasan apa pun – pelajari lebih lanjut di sini.
💎 Free Discord: discord.gg/Def47ueyuD
💎 Website: uptrick.io
Nothing is financial advice. Always do your own research.
💎 Website: uptrick.io
Nothing is financial advice. Always do your own research.
Pernyataan Penyangkalan
Informasi dan publikasi ini tidak dimaksudkan, dan bukan merupakan, saran atau rekomendasi keuangan, investasi, trading, atau jenis lainnya yang diberikan atau didukung oleh TradingView. Baca selengkapnya di Ketentuan Penggunaan.