PROTECTED SOURCE SCRIPT
VIX Delta Sentiment
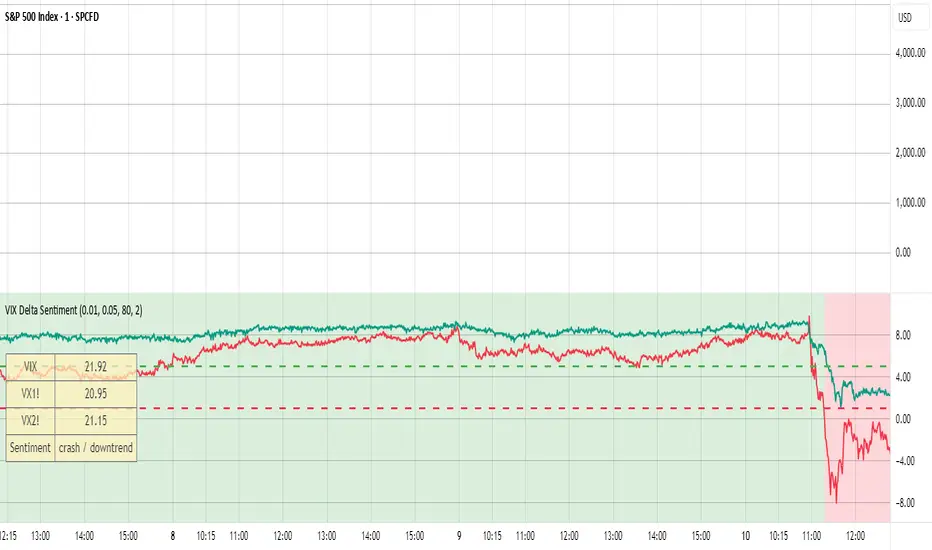
This script opens a new panel underneath the main panel.
It displays a table with the values of the CBOE volatility index VIX, which measures the last 30 days implied volatility of the S&P500 index, the VX1! and the VX2! values, which are the front month and the second month VIX futures.
To curves are plotted: the relative difference or delta of the two VIX futures as well as the relative delta between VIX and the first futures month. The dotted lines visualize the thresholds of these two relative deltas.
These values are needed to determine the market sentiment and to trigger a crash alert before it happens. It can be used to trade the major indices SPX, QQQ, etc. or to avoid catastrophic losses.
The market sentiment is annotated in the table and also visualized as background color.
Skrip terproteksi
Skrip ini diterbitkan sebagai sumber tertutup. Namun, Anda dapat menggunakannya dengan bebas dan tanpa batasan apa pun – pelajari lebih lanjut di sini.
Pernyataan Penyangkalan
Informasi dan publikasi ini tidak dimaksudkan, dan bukan merupakan, saran atau rekomendasi keuangan, investasi, trading, atau jenis lainnya yang diberikan atau didukung oleh TradingView. Baca selengkapnya di Ketentuan Penggunaan.