OPEN-SOURCE SCRIPT
Diupdate Psychological Lines
**The Option Chain Shows Strike Price Levels per Index Option**
- **Bank Nifty Index:** 100-point difference or gap between two strike prices.
- **Nifty 50 Index:** 50-point difference or gap between two strike prices.
- **FinNifty 50 Index:** 50-point difference or gap between two strike prices.
**Importance of These Levels:**
- When prices trade at these levels, the option premium either increases or decreases.
- Round numbers always affect option prices.
- Psychological round numbers have a significant impact and act as support and resistance.
- More strangle or straddle positions are created at these levels.
- More call writers or put writers trade at these levels.
**Benefits of Plotting Levels on Charts:**
- Having levels to plot on the chart is always helpful while trading and aids in taking trade positions accordingly.
**Indicator Features:**
- Helps users with various functionalities.
- Allows users to plot lines as needed and adjust the gap between lines as per requirements or option strikes.
- User input to show the number of lines on the chart.
- Tooltip on each level, indicating the current price (LTP) and the difference in points from the LTP.
- Simple to use.
- User-friendly.
- Enhances trading experience with the help of lines.
---
These adjustments should make the text clearer and more professional. If you need any further changes, feel free to ask!
Catatan Rilis
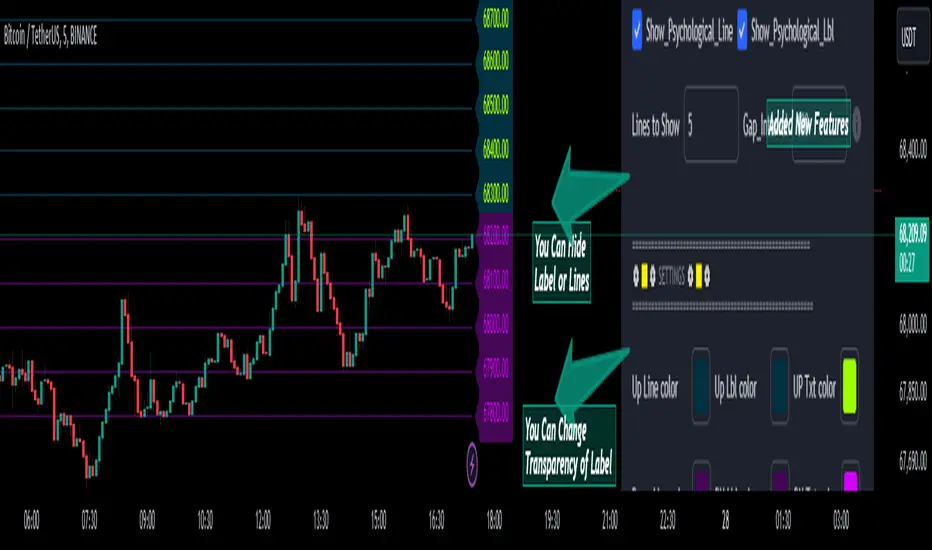
Now that the Script is Updated the overlapping of label & Line issue is solved.Catatan Rilis
Group & Settings Added ( Updated)Catatan Rilis
The improved script looks well-organized and feature-rich! Here are a few notable enhancements and additions in the code:
User Input for Customization: The script allows users to customize the number of lines, gap interval, line and label colors, transparency, and line width. This makes it highly adaptable to different charting needs.
Tooltips: You've added tooltips to the labels, which provide detailed information about the lines and their positions relative to the current close price. This is a great feature for better understanding and analysis.
Conditional Display: Lines and labels are drawn based on user input, ensuring that unnecessary elements are not plotted if not needed.
Color and Transparency: Customizable colors and transparency for labels enhance visual clarity and chart readability.
This updated version should provide a cleaner and more informative chart experience. If you have any specific questions or need further improvements, feel free to ask!
Skrip open-source
Dengan semangat TradingView yang sesungguhnya, pembuat skrip ini telah menjadikannya sebagai sumber terbuka, sehingga para trader dapat meninjau dan memverifikasi fungsinya. Salut untuk penulisnya! Meskipun Anda dapat menggunakannya secara gratis, perlu diingat bahwa penerbitan ulang kode ini tunduk pada Tata Tertib kami.
Pernyataan Penyangkalan
Informasi dan publikasi ini tidak dimaksudkan, dan bukan merupakan, saran atau rekomendasi keuangan, investasi, trading, atau jenis lainnya yang diberikan atau didukung oleh TradingView. Baca selengkapnya di Ketentuan Penggunaan.