OPEN-SOURCE SCRIPT
SRG Fibs Smoothed
PLEASE READ: HOW TO UNDERSTAND HOW THIS INDICATOR WORKS FOR ME!
Why did I code this?
I never know where is the best place to buy
Sometimes I get greedy and just don't want to sell...
I want to protect myself from losses and still be able to make some trades
What does this do?
This script plots Fibonacci levels dynamically according to a specified length
It also has a smooting value so it looks a bit more clean (and allows for dynamic trailing stop loss)
Internal Fib levels allow to plot fibonacci levels between each main level (scalpers and day traders should be happy with this)
Fib Projection toggle so we can have "the same behaviour" during aggressive Bull Runs.
How to test this thing?
BTC USD Daily chart
For starters, use the following settings:
- Length: 365 (lookback of a full year)
- Smooth: 56 (8 week period)
- Inter Fib levels: OFF
- Fib projection: OFF
Have a look into the chart and check some support/resistance zones. Also check the behaviour of the indicator during the 2021 Jan -> Mar bull run (we will need it later)
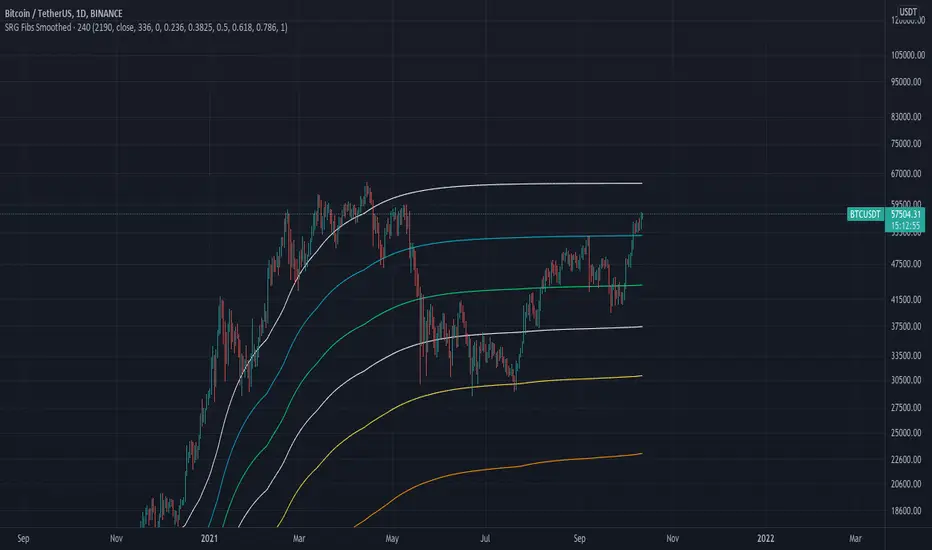
If you like to check different time frames. Use these settings:
- Indicator Timeframe: 4 hours
- Length: 2190 (1 year)
- Smooth: 336 (8 weeks)
- Inter Fib Levels: ON
- Fib Projection: OFF
You can now test the chart using the 2H timeframe to see the movement, and how the Internal Fib levels work
Now as we're getting bullish:
- Indicator Timeframe: 4 hours
- Length: 2190 (1 year)
- Smooth: 336 (8 weeks)
- Inter Fib Levels: OFF
- Fib Projection: ON
You can now check the behaviour of the indicator during the 2021 Jan - Mar Bullrun in the 2H or 4H chart, to see some stop loss magic.
Why did I code this?
I never know where is the best place to buy
Sometimes I get greedy and just don't want to sell...
I want to protect myself from losses and still be able to make some trades
What does this do?
This script plots Fibonacci levels dynamically according to a specified length
It also has a smooting value so it looks a bit more clean (and allows for dynamic trailing stop loss)
Internal Fib levels allow to plot fibonacci levels between each main level (scalpers and day traders should be happy with this)
Fib Projection toggle so we can have "the same behaviour" during aggressive Bull Runs.
How to test this thing?
BTC USD Daily chart
For starters, use the following settings:
- Length: 365 (lookback of a full year)
- Smooth: 56 (8 week period)
- Inter Fib levels: OFF
- Fib projection: OFF
Have a look into the chart and check some support/resistance zones. Also check the behaviour of the indicator during the 2021 Jan -> Mar bull run (we will need it later)
If you like to check different time frames. Use these settings:
- Indicator Timeframe: 4 hours
- Length: 2190 (1 year)
- Smooth: 336 (8 weeks)
- Inter Fib Levels: ON
- Fib Projection: OFF
You can now test the chart using the 2H timeframe to see the movement, and how the Internal Fib levels work
Now as we're getting bullish:
- Indicator Timeframe: 4 hours
- Length: 2190 (1 year)
- Smooth: 336 (8 weeks)
- Inter Fib Levels: OFF
- Fib Projection: ON
You can now check the behaviour of the indicator during the 2021 Jan - Mar Bullrun in the 2H or 4H chart, to see some stop loss magic.
Skrip open-source
Dengan semangat TradingView yang sesungguhnya, pembuat skrip ini telah menjadikannya sebagai sumber terbuka, sehingga para trader dapat meninjau dan memverifikasi fungsinya. Salut untuk penulisnya! Meskipun Anda dapat menggunakannya secara gratis, perlu diingat bahwa penerbitan ulang kode ini tunduk pada Tata Tertib kami.
Pernyataan Penyangkalan
Informasi dan publikasi ini tidak dimaksudkan, dan bukan merupakan, saran atau rekomendasi keuangan, investasi, trading, atau jenis lainnya yang diberikan atau didukung oleh TradingView. Baca selengkapnya di Ketentuan Penggunaan.