OPEN-SOURCE SCRIPT
Diupdate [_ParkF]MFI+

Added the Moneyflow Index indicator.
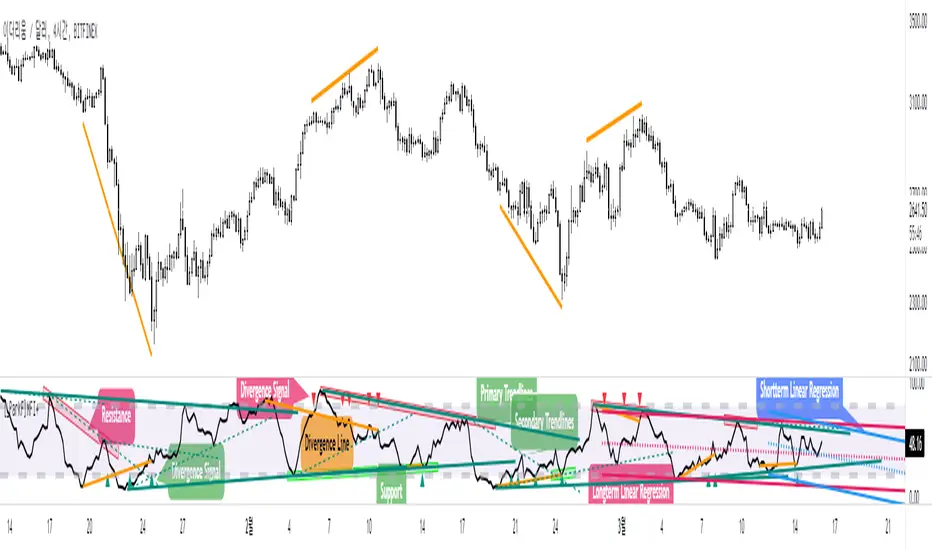
Divergence signals and diversion lines are drawn.
Support and resistance were also confirmed when linear regression and trend lines were used for the Moneyflow Index.
Two linear regression and two trend lines are drawn.
Because the two linear regression values are different, you can see the support and resistance of long-term and short-term linear regression.
Since the periodic values of the two trend lines are also different, support and resistance that could not be identified in linear regression can be identified.
Each linear regression line and trend line can be turned on or off.
In addition, each linear regression line and trend line can arbitrarily modify period values and deviation values.
I hope it will help you trade.
-------------------------------------------------------------------------------------------------------------------------------------------------------------------------------------------
머니플로우인덱스 지표를 추가하였습니다.
다이버전스 신호와 다이버전스 라인이 그려집니다.
머니플로우인덱스에도 선형회귀와 추세선을 이용했을 때 지지와 저항이 확인이 되었습니다.
2개의 선형회귀와 2개의 추세선이 그려지고
두 선형 회귀 값은 서로 다르기 때문에 장기 및 단기 선형 회귀의 지지 및 저항을 확인할 수 있습니다.
두 추세선의 주기 값도 다르므로 선형 회귀 분석에서 확인할 수 없었던 지지 및 저항을 확인할 수 있습니다.
각 선형 회귀선 및 추세선은 켜거나 끌 수 있습니다.
또한 각 선형 회귀선 및 추세선은 주기 값과 편차 값을 임의로 수정할 수 있습니다.
당신의 트레이딩에 도움이 되었으면 합니다.
-------------------------------------------------------------------------------------------------------------------------------------------------------------------------------------------
* I would like to express my gratitude to zdmre for revealing the linear regression source.
* I would like to express my gratitude to aaahopper for revealing the trendlines source.
Catatan Rilis
The moneyflow index candle has been added and the default is Line.Catatan Rilis
Added Divs line colorAdded Trendlines input options
Skrip open-source
Dengan semangat TradingView yang sesungguhnya, pembuat skrip ini telah menjadikannya sebagai sumber terbuka, sehingga para trader dapat meninjau dan memverifikasi fungsinya. Salut untuk penulisnya! Meskipun Anda dapat menggunakannya secara gratis, perlu diingat bahwa penerbitan ulang kode ini tunduk pada Tata Tertib kami.
Pernyataan Penyangkalan
Informasi dan publikasi ini tidak dimaksudkan, dan bukan merupakan, saran atau rekomendasi keuangan, investasi, trading, atau jenis lainnya yang diberikan atau didukung oleh TradingView. Baca selengkapnya di Ketentuan Penggunaan.