PROTECTED SOURCE SCRIPT
Diupdate Ricco Bull Market Support Band
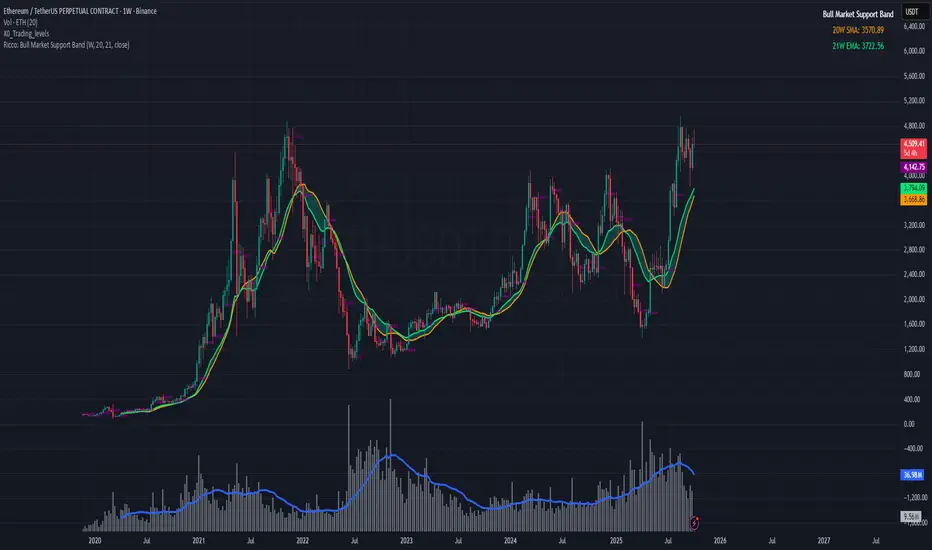
Bull Market Support Band (20W SMA + 21W EMA)
Overview:
The Bull Market Support Band combines the 20-week Simple Moving Average (SMA) and the 21-week Exponential Moving Average (EMA) to form a dynamic support and resistance zone. This concept is widely used in crypto analysis (especially for Bitcoin and Ethereum) to identify bull and bear market phases.
When price trades above the band, it indicates market strength and a potential continuation of a bull market. When price falls below the band, it often signals weakness and the start of a bear phase. When price oscillates within the band, it usually represents consolidation or a transition between trends.
How It Works:
Features:
Usage Tips:
Interpretation Guide:
Above Band → Strong uptrend or bull market continuation
Within Band → Transition, consolidation, or neutral zone
Below Band → Downtrend or potential bear market
Credits:
Concept inspired by the original Bull Market Support Band idea popularized in crypto market analysis.
Pine Script v6 implementation by Ricco, designed for clarity, flexibility, and alert functionality.
Overview:
The Bull Market Support Band combines the 20-week Simple Moving Average (SMA) and the 21-week Exponential Moving Average (EMA) to form a dynamic support and resistance zone. This concept is widely used in crypto analysis (especially for Bitcoin and Ethereum) to identify bull and bear market phases.
When price trades above the band, it indicates market strength and a potential continuation of a bull market. When price falls below the band, it often signals weakness and the start of a bear phase. When price oscillates within the band, it usually represents consolidation or a transition between trends.
How It Works:
- Plots two moving averages: 20-week SMA and 21-week EMA
- Shades the area between them to form a visual “support band”
- Uses a selectable higher timeframe (weekly by default)
- Works on any chart timeframe
Features:
- User-selectable calculation timeframe (default: Weekly)
- Customizable lengths, colors, and fill opacity
- Optional bull/bear/neutral state labels
- Built-in alert conditions:
- Price crosses above the band
- Price crosses below the band
- Price crosses either moving average line - On-chart legend showing live SMA and EMA values
Usage Tips:
- Best used on higher timeframes (1D, 1W, 1M) for trend confirmation
- In uptrends, the band often acts as dynamic support
- In downtrends, it becomes resistance
- Combine with momentum or volume indicators (e.g., RSI, MACD, OBV)
- Works well with 200-day moving average or Fibonacci retracement levels for confluence
Interpretation Guide:
Above Band → Strong uptrend or bull market continuation
Within Band → Transition, consolidation, or neutral zone
Below Band → Downtrend or potential bear market
Credits:
Concept inspired by the original Bull Market Support Band idea popularized in crypto market analysis.
Pine Script v6 implementation by Ricco, designed for clarity, flexibility, and alert functionality.
Catatan Rilis
Bull Market Support Band (20W SMA + 21W EMA)Overview:
The Bull Market Support Band combines the 20-week Simple Moving Average (SMA) and the 21-week Exponential Moving Average (EMA) to form a dynamic support and resistance zone. This concept is widely used in crypto analysis (especially for Bitcoin and Ethereum) to identify bull and bear market phases.
When price trades above the band, it indicates market strength and a potential continuation of a bull market. When price falls below the band, it often signals weakness and the start of a bear phase. When price oscillates within the band, it usually represents consolidation or a transition between trends.
How It Works:
- Plots two moving averages: 20-week SMA and 21-week EMA
- Shades the area between them to form a visual “support band”
- Uses a selectable higher timeframe (weekly by default)
- Works on any chart timeframe
Features:
- User-selectable calculation timeframe (default: Weekly)
- Customizable lengths, colors, and fill opacity
- Optional bull/bear/neutral state labels
- Built-in alert conditions:
- Price crosses above the band
- Price crosses below the band
- Price crosses either moving average line - On-chart legend showing live SMA and EMA values
Usage Tips:
- Best used on higher timeframes (1D, 1W, 1M) for trend confirmation
- In uptrends, the band often acts as dynamic support
- In downtrends, it becomes resistance
- Combine with momentum or volume indicators (e.g., RSI, MACD, OBV)
- Works well with 200-day moving average or Fibonacci retracement levels for confluence
Interpretation Guide:
Above Band → Strong uptrend or bull market continuation
Within Band → Transition, consolidation, or neutral zone
Below Band → Downtrend or potential bear market
Credits:
Concept inspired by the original Bull Market Support Band idea popularized in crypto market analysis.
Pine Script v6 implementation by Ricco, designed for clarity, flexibility, and alert functionality.
Skrip terproteksi
Skrip ini diterbitkan sebagai sumber tertutup. Namun, anda dapat menggunakannya secara bebas dan tanpa batasan apa pun – pelajari lebih lanjut di sini.
Pernyataan Penyangkalan
Informasi dan publikasi tidak dimaksudkan untuk menjadi, dan bukan merupakan saran keuangan, investasi, perdagangan, atau rekomendasi lainnya yang diberikan atau didukung oleh TradingView. Baca selengkapnya di Persyaratan Penggunaan.