PROTECTED SOURCE SCRIPT
B&W HEATMAP
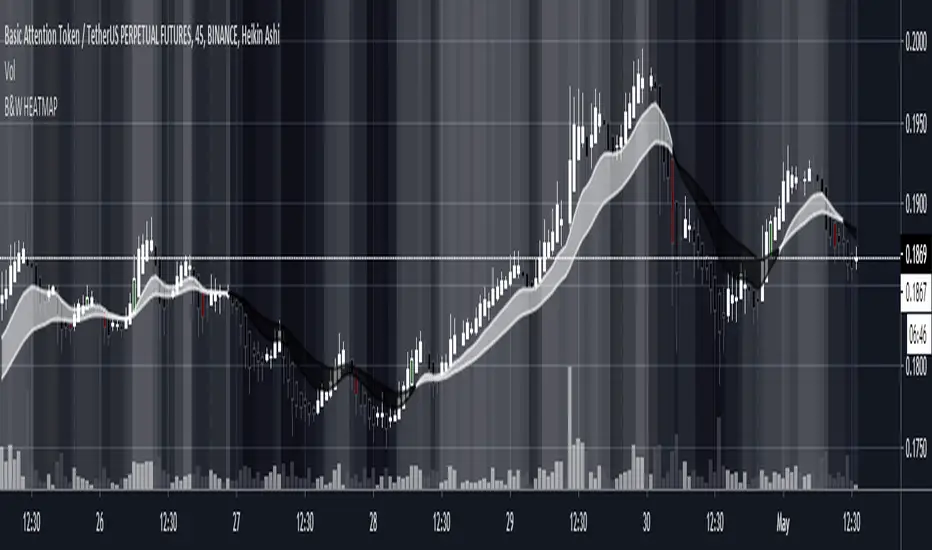
A Black and white heatmap (you can change to any colors in settings) overlay for better trend analysis. Use the crossovers to determine directional bias. Can be used with any other MA cross, baseline, or trendline strategies to help decide if a trade is worth taking. The gradient from black to white represent the strength of the trend . Black = Downtrend, White = Uptrend, Gray=range/chop. Candle colors indicate potential Long/Short
Skrip terproteksi
Skrip ini diterbitkan sebagai sumber tertutup. Namun, Anda dapat menggunakannya dengan bebas dan tanpa batasan apa pun – pelajari lebih lanjut di sini.
Pernyataan Penyangkalan
Informasi dan publikasi ini tidak dimaksudkan, dan bukan merupakan, saran atau rekomendasi keuangan, investasi, trading, atau jenis lainnya yang diberikan atau didukung oleh TradingView. Baca selengkapnya di Ketentuan Penggunaan.