PROTECTED SOURCE SCRIPT
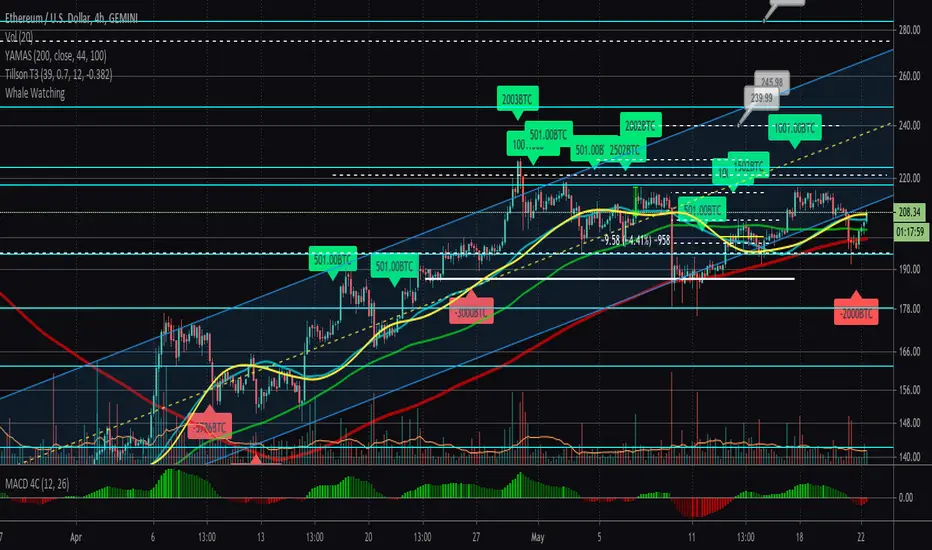
Diupdate Whale Watching

In following the movement of large amounts of BTC onto exchanges, I noticed one wallet in particular (3Kzh9qAqVWQhEsfQz7zEQL1EuSx5tyNLNS) was moving large amounts of BTC onto exchanges prior to relatively significant declines in BTC's price. Tracing this wallet revealed it also receives large deposits and is a fairly significant wallet on the blockchain. Full details can be viewed here: bitinfocharts.com/bitcoin/address/3Kzh9qAqVWQhEsfQz7zEQL1EuSx5tyNLNS
This script takes the data of significant BTC moves in and out of this wallet and places it on a chart to facilitate a visual comparison of wallet movements and BTC price movements.
Like all indicators, this script will apply over all your charts unless turned off. It may or may not be interesting to see how this wallet affects other charts.
TradingView does not allow pulling live data into a script so this will be manually updated over time as new data occurs, but it will never be 100% up-to-date.
Catatan Rilis
Updated for April 30th, 2020Catatan Rilis
Updated May 2nd, 2020Catatan Rilis
New entries May 8th, 2020Catatan Rilis
Updated for May 22nd, 2020 wallet movementsSkrip terproteksi
Skrip ini diterbitkan sebagai sumber tertutup. Namun, Anda dapat menggunakannya dengan bebas dan tanpa batasan apa pun – pelajari lebih lanjut di sini.
Pernyataan Penyangkalan
Informasi dan publikasi ini tidak dimaksudkan, dan bukan merupakan, saran atau rekomendasi keuangan, investasi, trading, atau jenis lainnya yang diberikan atau didukung oleh TradingView. Baca selengkapnya di Ketentuan Penggunaan.
Skrip terproteksi
Skrip ini diterbitkan sebagai sumber tertutup. Namun, Anda dapat menggunakannya dengan bebas dan tanpa batasan apa pun – pelajari lebih lanjut di sini.
Pernyataan Penyangkalan
Informasi dan publikasi ini tidak dimaksudkan, dan bukan merupakan, saran atau rekomendasi keuangan, investasi, trading, atau jenis lainnya yang diberikan atau didukung oleh TradingView. Baca selengkapnya di Ketentuan Penggunaan.