PROTECTED SOURCE SCRIPT
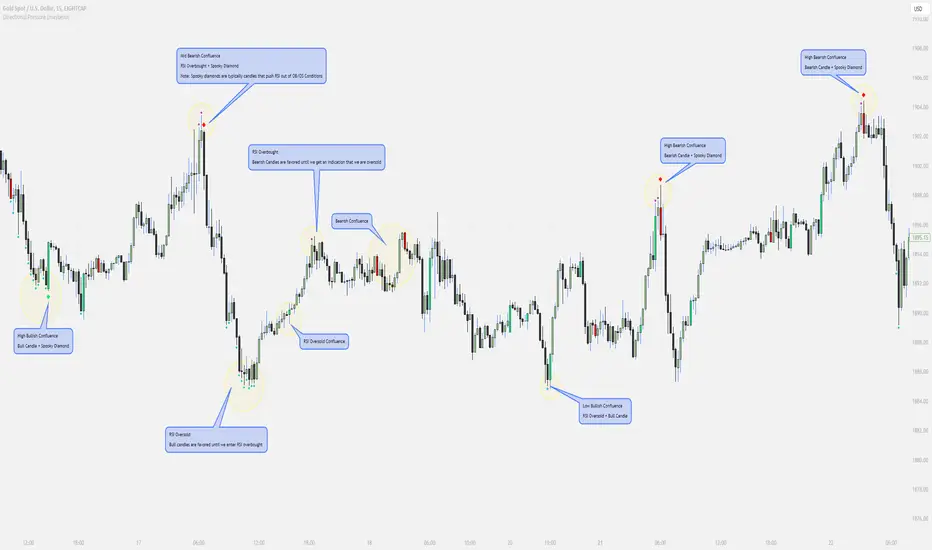
Directional Pressure (maybexo)

Liquidity Candles, observed in financial markets, display distinctive candlestick patterns that are noteworthy. These candles exhibit intentional price behavior aimed at triggering stop-loss orders and momentarily misleading traders. The pattern typically starts with a price movement against the current trend, activating stop-loss orders and capitalizing on liquidity from traders anticipating the prevailing trend. Subsequently, the price swiftly changes course, breaking and conclusively closing beyond the prior candle's range, often surprising unsuspecting traders.
Characteristics:
1. Liquidity Grab:
- Liquidity Candles initiate with a deliberate move against the existing trend, aimed at triggering stop-loss orders and gathering liquidity from traders who have placed stops in anticipation of the initial trend.
- Notably, the size of the wick in this liquidity grab is significant; a larger wick indicates a more substantial liquidity grab and can strengthen the indication of a potential market reversal.
2. Swift Reversal and Breakout:
- Following the liquidity grab, the price swiftly changes direction, breaking and conclusively closing above or below the previous candle's range.
3. Institutional Behavior:
- These candles are often linked to institutional trading behavior, suggesting potential involvement by significant market participants due to their distinct and deliberate price action.
// Diamonds
1. RSI Diamonds:
The RSI Diamonds represent RSI entering either overbought or oversold levels.
These Diamonds serve as an early indication for "Spooky Diamonds" as Spooky Diamonds can only form in these conditions
2. Spooky Diamonds:
The Spooky Diamonds highlight specific candle conditions, aiding in the identification of bullish or bearish momentum in the market while considering the RSI status.
Bullish Candle Momentum: The candle size is greater than the previous candle multiplied by a user-defined factor (filterMultiplier) and the closing price is higher than the opening price. This can suggest bullish momentum.
Bearish Candle Momentum: The candle size is greater than the previous candle multiplied by the filterMultiplier, and the closing price is lower than the opening price. This can suggest bearish momentum.
Important Notes:
The Candles + Diamonds should not be used in isolation as buy or sell signals but rather as additional information for your trading strategy.
The goal of this indicator is to provide a visual representation of RSI data and potential momentum during overbought or oversold conditions.
By utilizing the diamonds and candles, you can easily identify RSI levels and their interaction with candles, aiding in decision-making within your trading strategy.
Disclaimer: Always consider your risk tolerance and conduct thorough analysis before making any trading decisions.
Inspiration Credits:
Vanitati
Mr. Casino
Skrip terproteksi
Skrip ini diterbitkan sebagai sumber tertutup. Namun, anda dapat menggunakannya secara bebas dan tanpa batasan apa pun – pelajari lebih lanjut di sini.
Pernyataan Penyangkalan
Informasi dan publikasi tidak dimaksudkan untuk menjadi, dan bukan merupakan saran keuangan, investasi, perdagangan, atau rekomendasi lainnya yang diberikan atau didukung oleh TradingView. Baca selengkapnya di Persyaratan Penggunaan.