OPEN-SOURCE SCRIPT
Diupdate Kaschko's Seasonal Trend

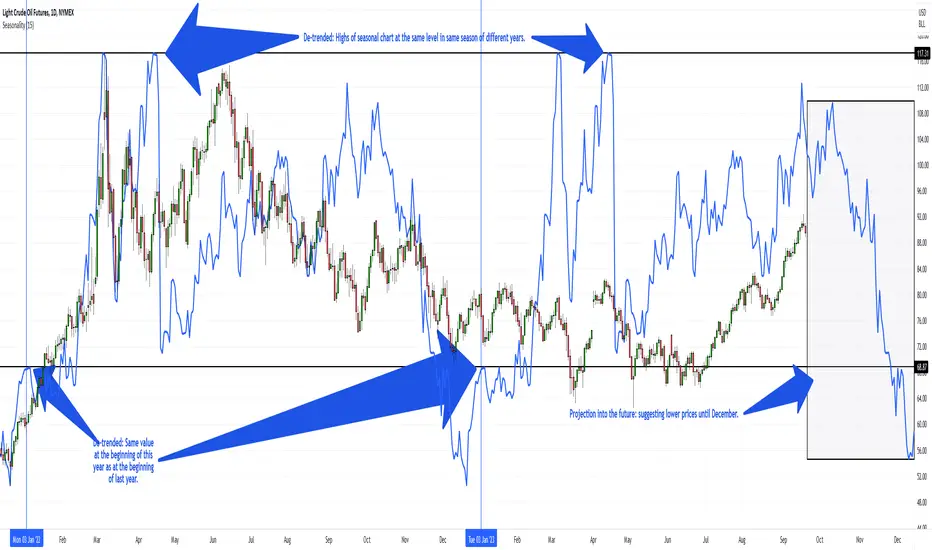
This script calculates the average price moves (using each bar's close minus the previous bar's close) for the trading days, weeks or months (depending on the timeframe it is applied to) of a number of past calendar years (up to 30) to construct a seasonal trend which is then drawn as a seasonal chart (overlay) onto the price chart. Supported are the 1D,1W,1M timeframes.
The seasonal chart is adjusted to the price chart (so that both occupy the same height on the overall chart) and it is also de-trended, which means that the seasonal chart's starting value is the same in each year and the progression during the year is adjusted so that no abrupt gap occurs between years and the highs and lows of consecutive years of the seasonal chart (if projected over more than one year) are also at the same level. Of course, this also means that the absolute value of the seasonal chart has no meaning at all.
You can configure the number of bars the seasonal chart is drawn into the future. This projection shows how price could move in the future if the market shows the same seasonal tendencies like in the past. On the daily chart, the trading week of year (TWOY), trading day of month (TDOM) and trading day of year (TDOY) are shown in the status line.
Caution is advised as seasonality is based on the past. It is not a reliable prediction of the future. But it can still be used as an additional confirmation or contradiction of an otherwise recognized possible impending trend.
I have used a virtually identical indicator for a long time in a commercial software package popular among futures traders, but have not found anything comparable here. Therefore I implemented it myself. I hope you find it useful.
Catatan Rilis
1. minor bug fixed in the scaling algorithm2. instead of always using fixed 252 trading days on the daily timeframe, the script now offers the option to use a variable number of trading days. The default is still fixed 252 trading days. When using a variable number of trading days, the actual number used results from the number of trading days within the years of the lookback period. You can choose to use the minimum, the maximum or the average number of trading days for all years. For crude oil futures (CL1!), the script will still use between 251 and 253 trading days. However, for Bitcoin (BTCUSD) it will actually use between 362 and 365 (or even 366) trading days. The actual number used is written to Pine Log.
Catatan Rilis
New features:1) Simple Moving Average / Smoothing
Instead of drawing the seasonal trend directly, optionally a moving average over a configurable number of bars can now be drawn. This smoothes out the seasonal trend line. The default is 1, i.e., do not apply a moving average.
2) Offset
You can now apply an offset to the seasonal trend line. A positive value shifts the line into the past, a negative value into the future. This is particularly useful when a moving average is used, as it causes the highs and lows of the seasonal trend to shift to the right (into the future). The best value for the offset depends on the value used for the moving average. It may take a few tries to find the most suitable combination of values. The default for the offset is 0, i.e., no offset.
Skrip open-source
Dengan semangat TradingView yang sesungguhnya, pembuat skrip ini telah menjadikannya sebagai sumber terbuka, sehingga para trader dapat meninjau dan memverifikasi fungsinya. Salut untuk penulisnya! Meskipun Anda dapat menggunakannya secara gratis, perlu diingat bahwa penerbitan ulang kode ini tunduk pada Tata Tertib kami.
Pernyataan Penyangkalan
Informasi dan publikasi ini tidak dimaksudkan, dan bukan merupakan, saran atau rekomendasi keuangan, investasi, trading, atau jenis lainnya yang diberikan atau didukung oleh TradingView. Baca selengkapnya di Ketentuan Penggunaan.