PROTECTED SOURCE SCRIPT
AHS_LongRun_System_V1.0
AHS_LongRun_System_V1.0 Indicator
Summary:
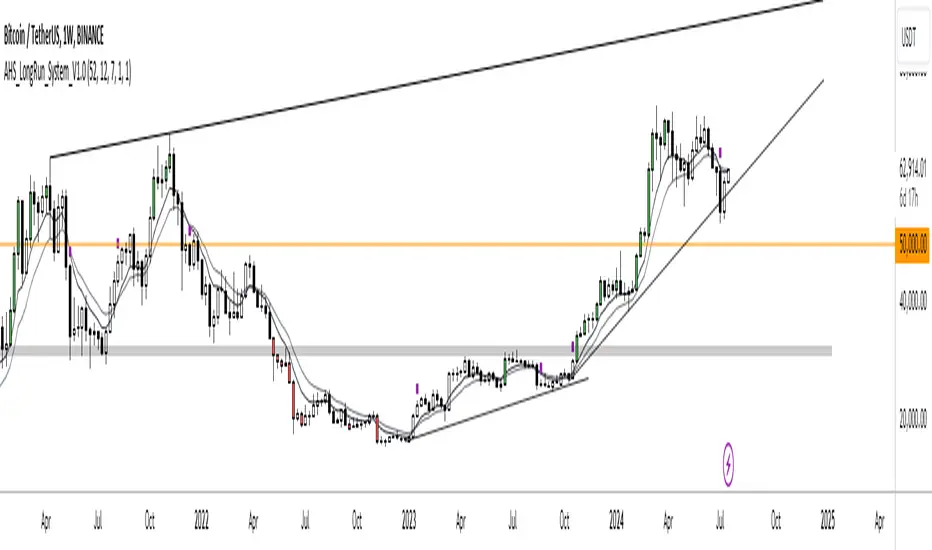
The "AHS_LongRun_System_V1.0" is a custom TradingView indicator designed to identify long-term bullish and bearish conditions based on the closing prices over a specified number of bars. The indicator also includes two Exponential Moving Averages (EMAs) for trend analysis and signals when these EMAs cross each other.
Features:
1. Bullish and Bearish Conditions:
- Bars to Compare: Set the number of bars to compare the current closing price against.
- Enable Bullish Painting: Toggle to color the bars green if the current close is higher than the closes of the specified number of bars.
-*Enable Bearish Painting: Toggle to color the bars red if the current close is lower than the closes of the specified number of bars.
2. Exponential Moving Averages (EMAs):
- EMA Lengths: Set the lengths for two EMAs.
- EMA Colors: Customize the colors for the two EMAs.
- EMA Line Widths: Set the line widths for the two EMAs.
- EMA Crosses: Visual markers (squares) to indicate where the two EMAs cross each other.
Usage:
1. Adding the Indicator:
- Add the "AHS_LongRun_System_V1.0" indicator to your TradingView chart.
2. Configuring Inputs:
- Bars to Compare: Adjust the number of bars to compare the current closing price against to detect long-term bullish or bearish conditions.
- Enable Bullish/Bearish Painting: Enable or disable the coloring of bars based on bullish or bearish conditions.
- EMA Lengths: Set the lengths for the two EMAs according to your preference or trading strategy.
- EMA Colors: Choose colors for the EMAs to differentiate them clearly.
- EMA Line Widths: Adjust the line widths for better visibility on the chart.
3. Using the Visuals:
- Bullish Bars: Bars are colored green if the current close is higher than the closes of the specified number of previous bars, indicating a bullish condition.
- Bearish Bars: Bars are colored red if the current close is lower than the closes of the specified number of previous bars, indicating a bearish condition.
- EMAs: The two EMAs are plotted on the chart with the specified colors and line widths.
- EMA Crosses: Purple squares are plotted on the chart to indicate where the two EMAs cross each other, signaling potential trend changes.
4. Alerts:
- Use the visual cues from the bar colors and EMA crosses to inform your trading decisions. Bullish conditions suggest potential buying opportunities, while bearish conditions suggest potential selling or shorting opportunities.
This indicator helps traders identify long-term trends by comparing current closing prices to historical closes and using EMAs to confirm trend directions and potential reversals.
Summary:
The "AHS_LongRun_System_V1.0" is a custom TradingView indicator designed to identify long-term bullish and bearish conditions based on the closing prices over a specified number of bars. The indicator also includes two Exponential Moving Averages (EMAs) for trend analysis and signals when these EMAs cross each other.
Features:
1. Bullish and Bearish Conditions:
- Bars to Compare: Set the number of bars to compare the current closing price against.
- Enable Bullish Painting: Toggle to color the bars green if the current close is higher than the closes of the specified number of bars.
-*Enable Bearish Painting: Toggle to color the bars red if the current close is lower than the closes of the specified number of bars.
2. Exponential Moving Averages (EMAs):
- EMA Lengths: Set the lengths for two EMAs.
- EMA Colors: Customize the colors for the two EMAs.
- EMA Line Widths: Set the line widths for the two EMAs.
- EMA Crosses: Visual markers (squares) to indicate where the two EMAs cross each other.
Usage:
1. Adding the Indicator:
- Add the "AHS_LongRun_System_V1.0" indicator to your TradingView chart.
2. Configuring Inputs:
- Bars to Compare: Adjust the number of bars to compare the current closing price against to detect long-term bullish or bearish conditions.
- Enable Bullish/Bearish Painting: Enable or disable the coloring of bars based on bullish or bearish conditions.
- EMA Lengths: Set the lengths for the two EMAs according to your preference or trading strategy.
- EMA Colors: Choose colors for the EMAs to differentiate them clearly.
- EMA Line Widths: Adjust the line widths for better visibility on the chart.
3. Using the Visuals:
- Bullish Bars: Bars are colored green if the current close is higher than the closes of the specified number of previous bars, indicating a bullish condition.
- Bearish Bars: Bars are colored red if the current close is lower than the closes of the specified number of previous bars, indicating a bearish condition.
- EMAs: The two EMAs are plotted on the chart with the specified colors and line widths.
- EMA Crosses: Purple squares are plotted on the chart to indicate where the two EMAs cross each other, signaling potential trend changes.
4. Alerts:
- Use the visual cues from the bar colors and EMA crosses to inform your trading decisions. Bullish conditions suggest potential buying opportunities, while bearish conditions suggest potential selling or shorting opportunities.
This indicator helps traders identify long-term trends by comparing current closing prices to historical closes and using EMAs to confirm trend directions and potential reversals.
Skrip terproteksi
Skrip ini diterbitkan sebagai sumber tertutup. Namun, Anda dapat menggunakannya dengan bebas dan tanpa batasan apa pun – pelajari lebih lanjut di sini.
Pernyataan Penyangkalan
Informasi dan publikasi ini tidak dimaksudkan, dan bukan merupakan, saran atau rekomendasi keuangan, investasi, trading, atau jenis lainnya yang diberikan atau didukung oleh TradingView. Baca selengkapnya di Ketentuan Penggunaan.