OPEN-SOURCE SCRIPT
Quarterly Performance
█ OVERVIEW
The Quarterly Performance indicator is designed to visualise and compare the performance of different Quarters of the year. This indicator explores one of the many calendar based anomalies that exist in financial markets.
In the context of financial analysis, a calendar based anomaly refers to patterns or tendencies that are linked to specific time periods, such as days of the week, weeks of the month, or months of the year. This indicator helps explore whether such a calendar based anomaly exists between quarters.
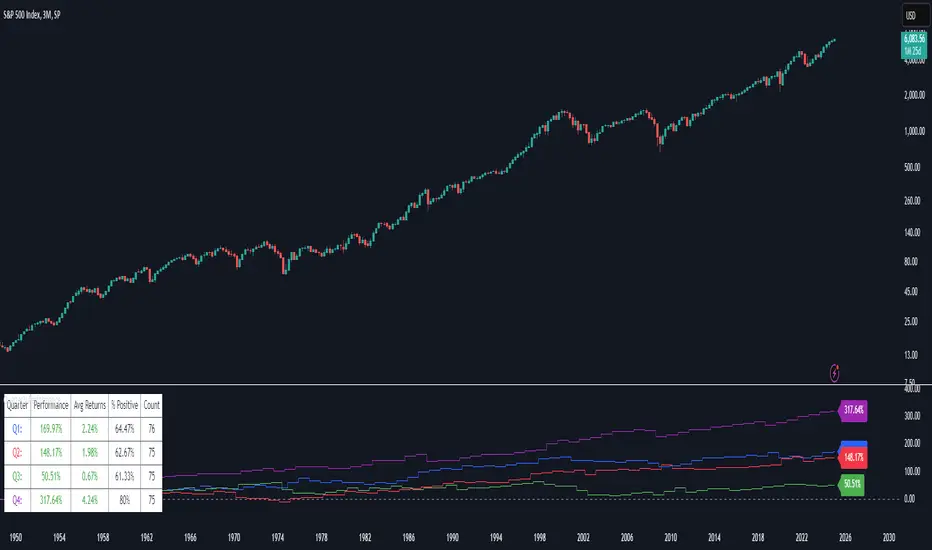
By calculating cumulative quarterly performance and counting the number of quarters with positive returns, it provides a clear snapshot of whether one set of quarters tends to outperform the others, potentially highlighting a calendar based anomaly if a significant difference is observed.
█ FEATURES
█ HOW TO USE
The Quarterly Performance indicator is designed to visualise and compare the performance of different Quarters of the year. This indicator explores one of the many calendar based anomalies that exist in financial markets.
In the context of financial analysis, a calendar based anomaly refers to patterns or tendencies that are linked to specific time periods, such as days of the week, weeks of the month, or months of the year. This indicator helps explore whether such a calendar based anomaly exists between quarters.
By calculating cumulative quarterly performance and counting the number of quarters with positive returns, it provides a clear snapshot of whether one set of quarters tends to outperform the others, potentially highlighting a calendar based anomaly if a significant difference is observed.
█ FEATURES
- Customisable time window through input settings.
- Tracks cumulative returns for each quarter separately.
- Easily adjust table settings like position and font size via input options.
- Clear visual distinction between quarterly performance using different colours.
- Built-in error checks to ensure the indicator is applied to the correct timeframe.
█ HOW TO USE
- Add the indicator to a chart with a 3 Month (Quarterly) timeframe.
- Choose your start and end dates in the Time Settings.
- Enable or disable the performance table in the Table Settings as needed.
- View the cumulative performance, with Q1 in blue, Q2 in red, Q3 in green and Q4 in purple.
Skrip open-source
Dengan semangat TradingView yang sesungguhnya, pembuat skrip ini telah menjadikannya sebagai sumber terbuka, sehingga para trader dapat meninjau dan memverifikasi fungsinya. Salut untuk penulisnya! Meskipun Anda dapat menggunakannya secara gratis, perlu diingat bahwa penerbitan ulang kode ini tunduk pada Tata Tertib kami.
Pernyataan Penyangkalan
Informasi dan publikasi ini tidak dimaksudkan, dan bukan merupakan, saran atau rekomendasi keuangan, investasi, trading, atau jenis lainnya yang diberikan atau didukung oleh TradingView. Baca selengkapnya di Ketentuan Penggunaan.