PROTECTED SOURCE SCRIPT
[VBose] Bank Nifty Volume With Accumulation/Distribution
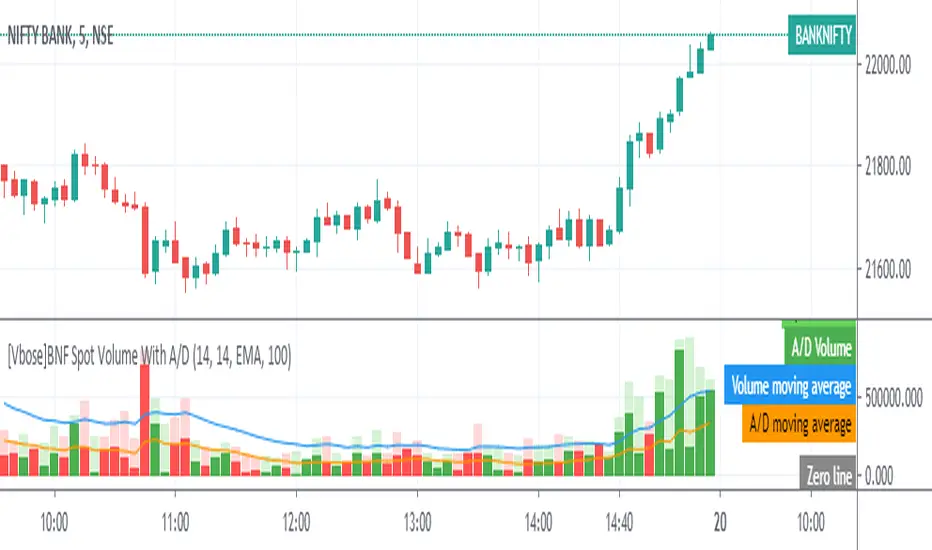
Bank Nifty Volume With Accumulation/Distribution Indicator shows Weighted Spot volume bars and the accumulated/distributed (A/D) portion of them. It calculates candle body to candle height ratio and multiplies it by Spot volume: Spot volume*(close-open)/(high-low)
The Spot Volume is calculated by the weighted sum (Composite method) of deriving stock volume from underlying 12 stocks in the Bank Nifty Index.
This Indicator has ability to multiply The Volume With Price and Take the Output of Volume or A/D to be fed as source in other indicators.
Light Green Color Shows Total Bull Volume [close]>[previous close] With Dark Green Color as Accumulation
Light Red Color Shows Total Bear Volume[close]<[previous close] With Dark Red Color as Distribution
Moving Average for Volume and A/D Line can be added with custom Moving Average Settings
Note:Trading view still does not provide Volume in Bank Nifty Index and this indicator calculates Spot Volume which is different than Futures Volume of Bank Nifty.
Skrip terproteksi
Skrip ini diterbitkan sebagai sumber tertutup. Namun, Anda dapat menggunakannya dengan bebas dan tanpa batasan apa pun – pelajari lebih lanjut di sini.
Pernyataan Penyangkalan
Informasi dan publikasi ini tidak dimaksudkan, dan bukan merupakan, saran atau rekomendasi keuangan, investasi, trading, atau jenis lainnya yang diberikan atau didukung oleh TradingView. Baca selengkapnya di Ketentuan Penggunaan.