OPEN-SOURCE SCRIPT
Valuation Metrics Table (P/S, P/E, etc.)
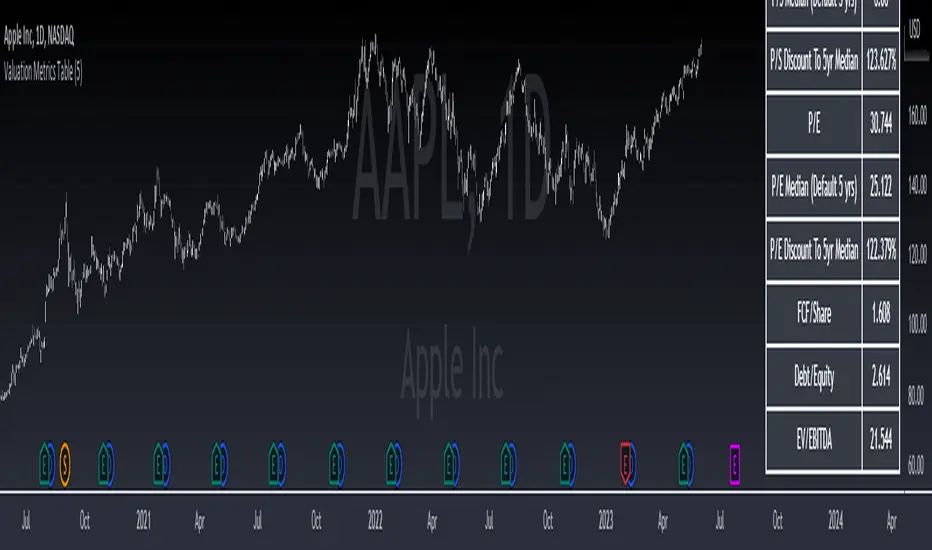
This table gives the user a very easy way of seeing many valuation metrics. I also included the 5 year median of the price to sales and price to earnings ratios. Then I calculated the percent difference between the median and the current ratio. This gives a sense of whether or not a stock is over valued or under valued based on historical data. The other ratios are well known and don't require any explanation. You can turn off the ones you don't want in the settings of the indicator. Another thing to mention is that diluted EPS is used in calculations
Skrip open-source
Dengan semangat TradingView yang sesungguhnya, pembuat skrip ini telah menjadikannya sebagai sumber terbuka, sehingga para trader dapat meninjau dan memverifikasi fungsinya. Salut untuk penulisnya! Meskipun Anda dapat menggunakannya secara gratis, perlu diingat bahwa penerbitan ulang kode ini tunduk pada Tata Tertib kami.
Pernyataan Penyangkalan
Informasi dan publikasi ini tidak dimaksudkan, dan bukan merupakan, saran atau rekomendasi keuangan, investasi, trading, atau jenis lainnya yang diberikan atau didukung oleh TradingView. Baca selengkapnya di Ketentuan Penggunaan.