OPEN-SOURCE SCRIPT
Diupdate MACD Multi-Timeframe Indicator
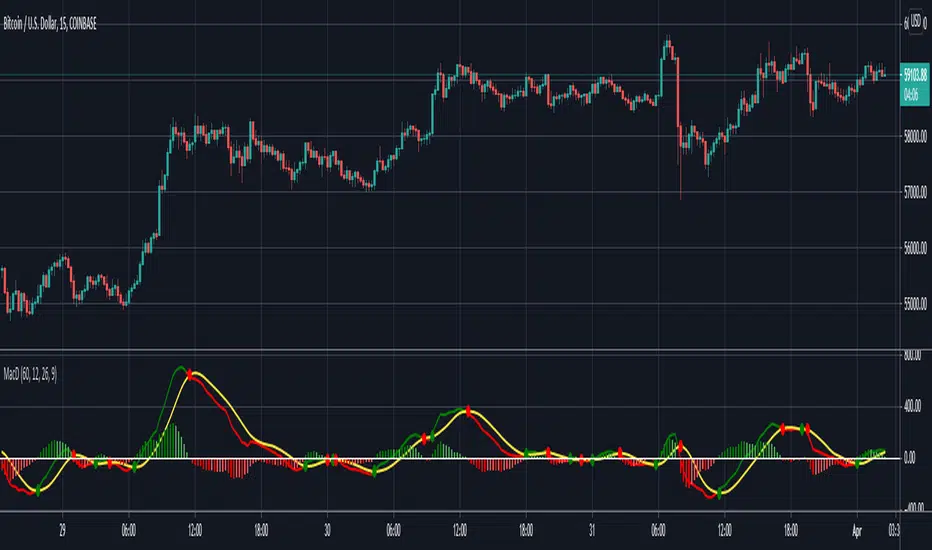
Hello everyone, this is indicator has always been my go-to MACD indicator for many years. It is such a beautiful easy to understand indicator. You can also view different timeframe resolutions which is helpful. When the MACD crosses up the signal line it is green, and when it crosses below the signal line it is red. The signal line is the constant yellow line. MACD histogram is dark green when increasing buying momentum, and you'll see the green get lighter when buy momentum is decreasing. As well, MACD histogram is dark red when increasing sell momentum, and you'll see the red get lighter when sell momentum is decreasing. I hope you guys love this macd design. Happy trading!
The MACD indicator can be used in many ways but my favorite way to use MACD by itself is by going long when macd < 0 & macd crosses above signal line, and going short when macd > 0 & macd crosses below signal line. I added those alerts for anyone interested.
The MACD indicator can be used in many ways but my favorite way to use MACD by itself is by going long when macd < 0 & macd crosses above signal line, and going short when macd > 0 & macd crosses below signal line. I added those alerts for anyone interested.
Catatan Rilis
I updated the script to version 5 and made the source code more readable to the community.Catatan Rilis
I fixed the MACD colors so they are more noticeable when MACD momentum is strong or weak.Skrip open-source
Dengan semangat TradingView yang sesungguhnya, pembuat skrip ini telah menjadikannya sebagai sumber terbuka, sehingga para trader dapat meninjau dan memverifikasi fungsinya. Salut untuk penulisnya! Meskipun Anda dapat menggunakannya secara gratis, perlu diingat bahwa penerbitan ulang kode ini tunduk pada Tata Tertib kami.
Pernyataan Penyangkalan
Informasi dan publikasi ini tidak dimaksudkan, dan bukan merupakan, saran atau rekomendasi keuangan, investasi, trading, atau jenis lainnya yang diberikan atau didukung oleh TradingView. Baca selengkapnya di Ketentuan Penggunaan.
Skrip open-source
Dengan semangat TradingView yang sesungguhnya, pembuat skrip ini telah menjadikannya sebagai sumber terbuka, sehingga para trader dapat meninjau dan memverifikasi fungsinya. Salut untuk penulisnya! Meskipun Anda dapat menggunakannya secara gratis, perlu diingat bahwa penerbitan ulang kode ini tunduk pada Tata Tertib kami.
Pernyataan Penyangkalan
Informasi dan publikasi ini tidak dimaksudkan, dan bukan merupakan, saran atau rekomendasi keuangan, investasi, trading, atau jenis lainnya yang diberikan atau didukung oleh TradingView. Baca selengkapnya di Ketentuan Penggunaan.