PROTECTED SOURCE SCRIPT
TRADE ORBIT:-Andean Oscillator with Buy/Sell + Background
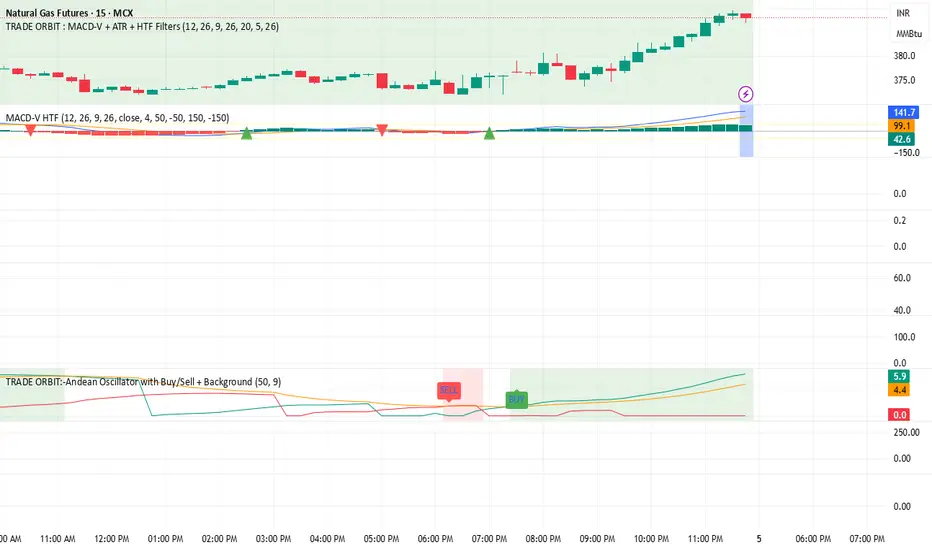
//=============================================================================
// DESCRIPTION
//-----------------------------------------------------------------------------
// The Andean Oscillator is a trend-momentum tool that compares bullish and
// bearish pressure using dynamic envelopes derived from price. It evaluates
// the strength of upward vs downward movement and generates trade signals
// when bullish or bearish momentum aligns above a smoothed signal line.
//
// COMPONENTS
// -----------
// • Bull : Represents bullish pressure
// • Bear : Represents bearish pressure
// • Signal: EMA smoothing of the stronger of Bull/Bear
//
// SIGNAL LOGIC
// -------------
// ✅ BUY signal is generated when:
// 1) Bull crosses above Bear
// 2) Bull then crosses above the Signal line
//
// ✅ SELL signal is generated when:
// 1) Bear crosses above Bull
// 2) Bear then crosses above the Signal line
//
// BACKGROUND COLORS
// -----------------
// • Green background → Bull > Bear and Bull > Signal
// • Red background → Bear > Bull and Bear > Signal
//
// PLOTS
// -----
// • Green plot → Bullish component
// • Red plot → Bearish component
// • Orange plot → Signal line
//
// ADDITIONAL NOTES
// ----------------
// • Uses envelope calculation with EMA smoothing
// • State-tracking ensures proper trend recognition
// • Alert conditions are included for Buy and Sell signals
//
//=============================================================================
Skrip terproteksi
Skrip ini diterbitkan sebagai sumber tertutup. Namun, anda dapat menggunakannya secara bebas dan tanpa batasan apa pun – pelajari lebih lanjut di sini.
Pernyataan Penyangkalan
Informasi dan publikasi tidak dimaksudkan untuk menjadi, dan bukan merupakan saran keuangan, investasi, perdagangan, atau rekomendasi lainnya yang diberikan atau didukung oleh TradingView. Baca selengkapnya di Persyaratan Penggunaan.