OPEN-SOURCE SCRIPT
Diupdate PO3 Time Dividers
//version=6
indicator("Smart Time Dividers (Auto)", overlay=true, max_lines_count=500)
// Appearance (change if you want)
line_color = color.new(#74757a, 50) // faint dark gray (0 = opaque, 255 = invisible)
line_style = line.style_dotted
line_width = 1
extend_type = extend.both
// time parts for current bar
y = year(time)
mo = month(time)
d = dayofmonth(time)
h = hour(time)
mi = minute(time)
// detect chart timeframe (common TradingView strings)
tf = timeframe.period
is_m1 = tf == "1"
is_m5 = tf == "5"
is_m15 = tf == "15"
is_h1 = (tf == "60") or (tf == "1H")
is_h4 = (tf == "240") or (tf == "4H")
is_d = (tf == "D") or (tf == "1D")
is_w = (tf == "W") or (tf == "1W")
// boundary checks (true on the first bar of the requested boundary)
new_year = y != y[1] // start of year
new_quarter = (mo != mo[1]) and (mo == 1 or mo == 4 or mo == 7 or mo == 10) // start of Q
new_month = mo != mo[1] // start of month
// week detection: use weekofyear if available, else use monday midnight fallback
new_week = false
//@compile_time_only
new_week := weekofyear(time) != weekofyear(time[1]) // this works in Pine v5
new_day = d != d[1] // start of day
new_4h = (h % 4 == 0) and (mi == 0) // start of 4-hour block
new_hour = mi == 0 // start of hour
// choose which boundary to draw depending on chart timeframe
boundary = false
if is_w
boundary := new_year // weekly -> yearly
else if is_d
boundary := new_quarter // daily -> quarterly
else if is_h4
boundary := new_month // 4h -> monthly
else if is_h1
boundary := new_week // 1h -> weekly
else if is_m15
boundary := new_day // 15m -> daily
else if is_m5
boundary := new_4h // 5m -> every 4 hours
else if is_m1
boundary := new_hour // 1m -> every hour
else
// fallback: draw monthly lines on unknown timeframes
boundary := new_month
// draw line only on the transition bar (avoid duplicates)
if boundary and not boundary[1]
line.new(x1=bar_index, y1=high, x2=bar_index, y2=low, xloc=xloc.bar_index,
extend=extend_type, color=line_color, style=line_style, width=line_width)
Catatan Rilis
//version=6indicator("PO3 Time Dividers", overlay=true, max_lines_count=500)
// --- Appearance ---
line_color = color.new(#74757a, 50) // faint dark gray
line_style = line.style_dotted
line_width = 1
extend_type = extend.both
// --- Current bar time in UTC ---
y = year(time("D", "UTC"))
mo = month(time("D", "UTC"))
d = dayofmonth(time("D", "UTC"))
h = hour(time("1", "UTC"))
mi = minute(time("1", "UTC"))
// --- Detect chart timeframe ---
tf = timeframe.period
is_m1 = tf == "1"
is_m5 = tf == "5"
is_m15 = tf == "15"
is_h1 = (tf == "60") or (tf == "1H")
is_h4 = (tf == "240") or (tf == "4H")
is_d = (tf == "D") or (tf == "1D")
is_w = (tf == "W") or (tf == "1W")
// --- Boundary checks ---
new_year = y != y[1] // start of year
new_month = month(time("M", "UTC")) != month(time("M", "UTC")[1]) // start of month
new_week = weekofyear(time("D", "UTC")) != weekofyear(time("D", "UTC")[1]) // start of week
new_day = d != d[1] // start of day
// --- Quarterly boundary: Jan 1, Apr 1, Jul 1, Oct 1 ---
new_quarter = (mo == 1 or mo == 4 or mo == 7 or mo == 10) and d == 1 and (mo != mo[1] or y != y[1])
// --- 4H and 1H boundaries aligned to midnight UTC ---
new_4h = (h % 4 == 0) and (mi == 0)
new_hour = mi == 0
// --- Determine which boundary to draw depending on chart timeframe ---
boundary = false
if is_w
boundary := new_year // weekly -> yearly
else if is_d
boundary := new_quarter // daily -> quarterly
else if is_h4
boundary := new_month // 4h -> monthly
else if is_h1
boundary := new_week // 1h -> weekly
else if is_m15
boundary := new_day // 15m -> daily
else if is_m5
boundary := new_4h // 5m -> every 4 hours
else if is_m1
boundary := new_hour // 1m -> every hour
else
boundary := new_month // fallback -> monthly
// --- Draw line only on the transition bar ---
if boundary and not boundary[1]
line.new(x1=bar_index, y1=high, x2=bar_index, y2=low, xloc=xloc.bar_index,
extend=extend_type, color=line_color, style=line_style, width=line_width)
Catatan Rilis
//version=6indicator("PO3 Time Dividers", overlay=true, max_lines_count=500)
// --- Appearance ---
line_color = color.new(#74757a, 51) // faint dark gray
line_style = line.style_dotted
line_width = 1
extend_type = extend.both
// --- Current bar time in UTC ---
y = year(time("D", "UTC"))
mo = month(time("D", "UTC"))
d = dayofmonth(time("D", "UTC"))
h = hour(time("1", "UTC"))
mi = minute(time("1", "UTC"))
// --- Detect chart timeframe ---
tf = timeframe.period
is_m1 = tf == "1"
is_m5 = tf == "5"
is_m15 = tf == "15"
is_h1 = (tf == "60") or (tf == "1H")
is_h4 = (tf == "240") or (tf == "4H")
is_d = (tf == "D") or (tf == "1D")
is_w = (tf == "W") or (tf == "1W")
// --- Boundary checks ---
new_year = y != y[1] // start of year
new_month = month(time("M", "UTC")) != month(time("M", "UTC")[1]) // start of month
new_week = weekofyear(time("D", "UTC")) != weekofyear(time("D", "UTC")[1]) // start of week
new_day = d != d[1] // start of day
// --- Quarterly boundary: Jan 1, Apr 1, Jul 1, Oct 1 ---
new_quarter = (mo == 1 or mo == 4 or mo == 7 or mo == 10) and d == 1 and (mo != mo[1] or y != y[1])
// --- 4H and 1H boundaries aligned to midnight UTC ---
new_4h = (h % 4 == 0) and (mi == 0)
new_hour = mi == 0
// --- Determine which boundary to draw depending on chart timeframe ---
boundary = false
if is_w
boundary := new_year // weekly -> yearly
else if is_d
boundary := new_quarter // daily -> quarterly
else if is_h4
boundary := new_month // 4h -> monthly
else if is_h1
boundary := new_week // 1h -> weekly
else if is_m15
boundary := new_day // 15m -> daily
else if is_m5
boundary := new_4h // 5m -> every 4 hours
else if is_m1
boundary := new_hour // 1m -> every hour
else
boundary := new_month // fallback -> monthly
// --- Draw line only on the transition bar ---
if boundary and not boundary[1]
line.new(x1=bar_index, y1=high, x2=bar_index, y2=low, xloc=xloc.bar_index,
extend=extend_type, color=line_color, style=line_style, width=line_width)
Catatan Rilis
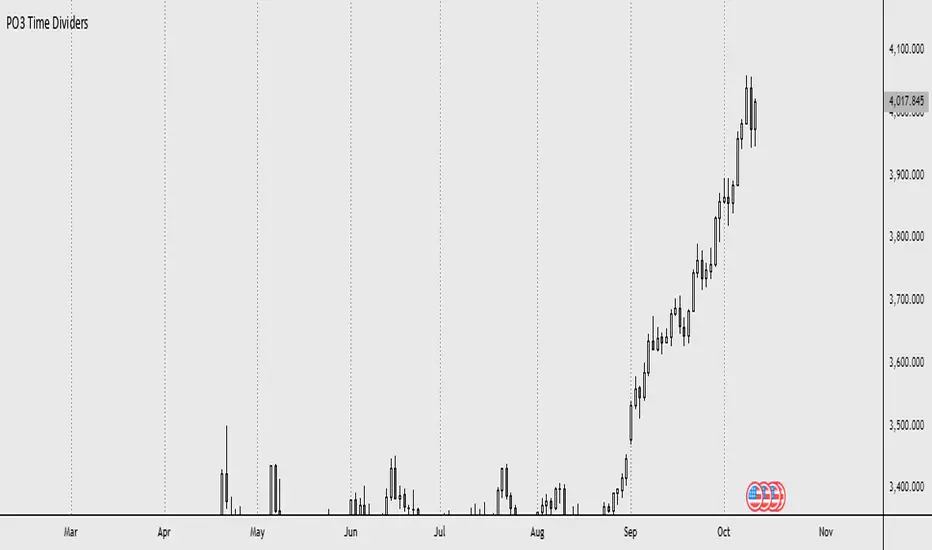
PO3 Timeframe DividersM = 12M
W = 3M
D = 1M
H4 = 1W
H1 = 1D
M15 = 1D
M5 = H4
M1 = H1
Skrip open-source
Dengan semangat TradingView yang sesungguhnya, penulis skrip ini telah menjadikannya sumber terbuka, sehingga para trader dapat meninjau dan memverifikasi fungsinya. Hormat untuk penulisnya! Meskipun anda dapat menggunakannya secara gratis, ingatlah bahwa penerbitan ulang kode tersebut tunduk pada Tata Tertib kami.
Pernyataan Penyangkalan
Informasi dan publikasi tidak dimaksudkan untuk menjadi, dan bukan merupakan saran keuangan, investasi, perdagangan, atau rekomendasi lainnya yang diberikan atau didukung oleh TradingView. Baca selengkapnya di Persyaratan Penggunaan.